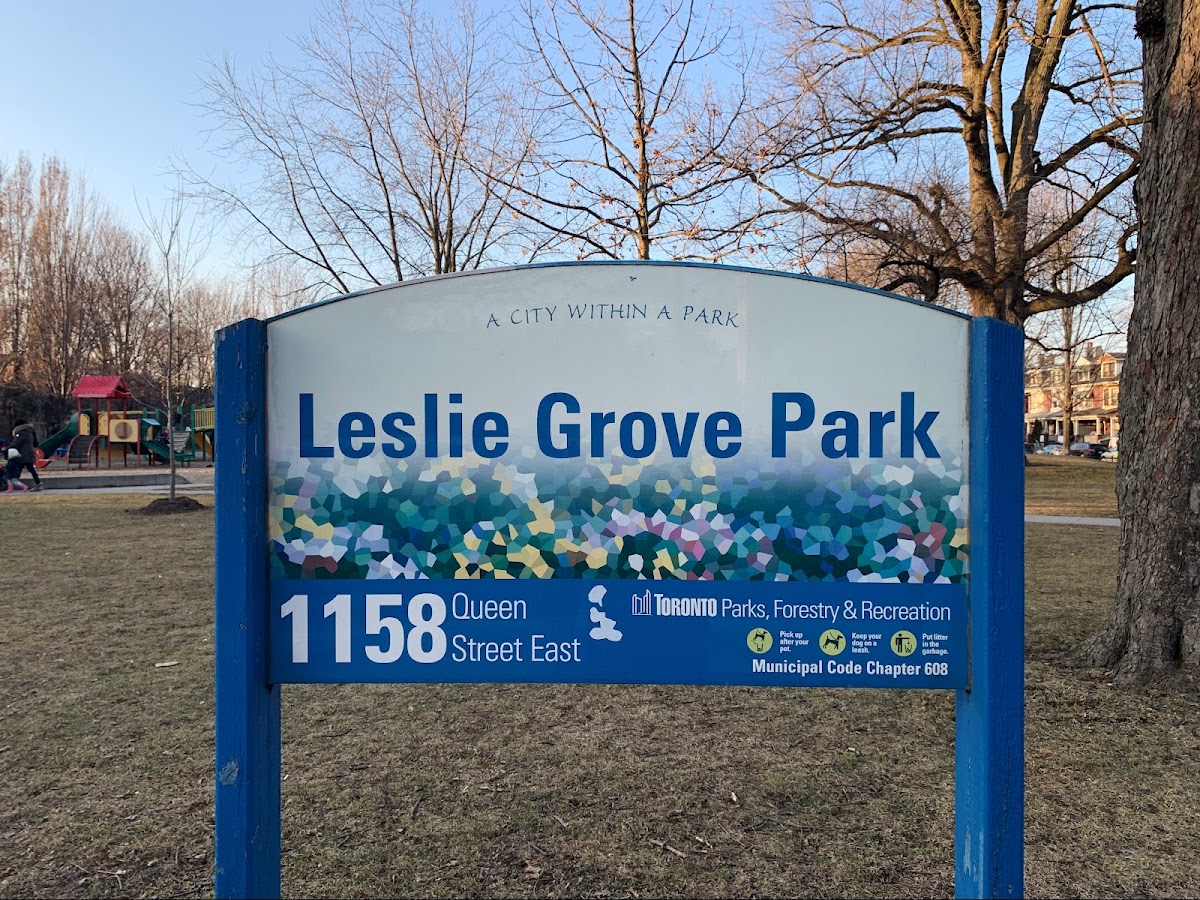
Leslie Grove Park
Parkette, one of the city's strongest overall (score 68, rank ~100th percentile). Strongest: edge activation; weakest: natural comfort.
Photo by Michael M via Google Places · cached 5/9/2026
Leslie Grove Park scores 68.2 / 100. Strongest dimensions: enclosure / eyes on park and edge activation. Weakest: amenity diversity (28.4). Border-vacuum risk is low. This score is a transparent reading of Jane Jacobs-style vitality factors, not a definitive judgment.
Area · 0.76 ha
Weighted across six dimensions · confidence 72%
Scores are not bell-curved. Percentiles and expected scores provide context without changing the underlying model.
Loading map…
The parks map is loading.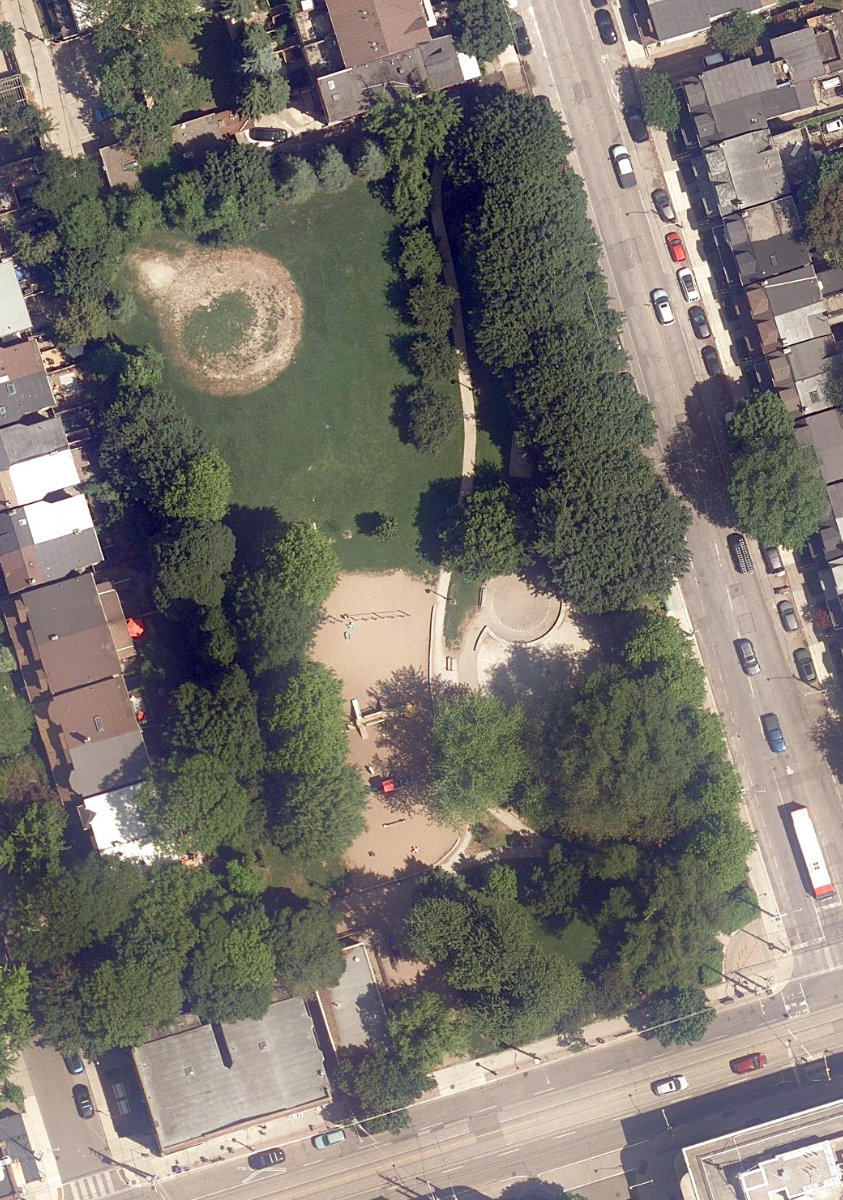
Explain this score
Where did the 68 come from? Each weighted contribution against a neutral 50 baseline. Green = pushed up; red = pulled down.
Sum of contributions = the headline score. A negative bar means that dimension dragged the park below the city-wide neutral baseline.
Why this park works
Leslie Grove Park works because its edge activation score (88) is one of the city's strongest and its connectivity (77) is also top decile (its perimeter is lined with active uses).
What limits this park
Leslie Grove Park doesn't have a clear weakness. Every measured dimension is at or above the middle of the pack.
Most distinctive characteristic
Most distinctive feature: exceptionally high edge activation (88, top decile).
Jacobs reading
Leslie Grove Park sits between an urban social park and an ecological retreat: moderately useful for both, exceptionally suited to neither.
Tradeoffs
- Connectivity (77) significantly outpaces natural comfort (42): well placed in the city but offers little shade or ecological respite.
Performance in context
- This park is a strong overperformer for its cohort: raw 68 versus an expected 36 for similar parks (small Parkette) (gap +32).
Typology classification
Classified as Parkette: small (7613 m²) with strong building frontage (31.6 per 100 m)
Edge Activation
Within 100 m of the park edge: 43 active uses (transit_stop, restaurant, retail, cafe) and 0 dead/hostile uses (none). Active edges keep "eyes on the park" through the day; parking lots, blank institutional walls, rail and highway frontages drain street life.
Source: OSM POIs (amenity/shop) + Toronto Building Footprints + land use
Connectivity
Connectivity blends paths, intersections, transit, entrances, and edge density. This park has 10 mapped paths/walkways and 30 sidewalk segments within 50 m; 17 street intersections within 100 m; 20 transit stops within a 400 m walk; 7 estimated access points across ~412 m of perimeter. edge density is healthy, no superblock penalty. Source coverage: centreline, pedestrian_network, transit_osm.
Source: Toronto Centreline V2 + Pedestrian Network + OSM transit stops
Amenity Diversity
3 distinct amenity types in the park (playground, tennis, washroom). Diversity, not raw count, drives the score so a park with many distinct activity types can outrank a larger park that repeats the same use.
Source: Toronto Parks & Recreation Facilities + OSM amenity tags
Natural Comfort
Natural-comfort components for this park: ~6.3% effective canopy (3.7% from contiguous tree polygons + scattered tree density); nearest waterbody ~1050 m; 9 city-mapped trees inside the polygon (9.0/ha). Reading: exposed. Source coverage: treed_area, waterbodies, street_trees. Impervious surface is approximated (Toronto's authoritative layer ships only as a raster GeoTIFF).
Source: Toronto Treed Area + Ravine + Waterbodies + Street Tree Inventory
Enclosure / Eyes on Park
130 buildings within 25 m of the park edge (36 mid-rise, 94 low-rise, 0 tower); avg edge height 8.3 m (~3 floors); 31.6 buildings per 100 m of 412 m perimeter (strong frontage density); edges are low-rise (mostly 2 to 3 floors); no towers immediately adjacent. "Eyes on the park" come strongest from the 36 mid-rise edge buildings.
Source: Toronto 3D Massing (building footprints + heights)
Border Vacuum Risk
Park edges face the city. No significant border vacuum detected.
Source: Toronto Street Centreline (highways) + rail layer + OSM landuse + building footprints
Equity Context
Equity Context requires inputs not yet loaded for this park (Toronto Neighbourhood Profiles). Score is held at a neutral 50 with low confidence. Read with caution.
Source: Toronto Neighbourhood Profiles
Amenities (3 types · 3 records)
- playground
- tennis
- washroom
Nearby active-edge features (70)
- transit stop: Jones Ave at Queen St E2 m
- cafe: Tango Palace Coffee Company4 m
- restaurant: Completo10 m
- transit stop: Jones Avenue11 m
- transit stop: Jones Avenue16 m
- retail: Just B Salon17 m
- transit stop: Jones Ave at Queen St E20 m
- retail: The Scene20 m
- restaurant: Nola Eatry & Bar20 m
- retail: Timeless Nail Spa26 m
- restaurant: Kibo Sushi House29 m
- transit stop: Jones Avenue29 m
- transit stop: Jones Avenue31 m
- restaurant: The BellyBuster Submarines31 m
- retail: The Frame Maker32 m
- restaurant: La Paella33 m
- retail: Woof Gang33 m
- retail: Emerald Hair & Beauty35 m
- retail: Unyozi Beauty37 m
- retail: Raise the Root38 m
- retail: Toronto Scuba Centre39 m
- retail: Love Me Do Baby43 m
- restaurant: Radical Road Brewing Co.44 m
- retail: Scout47 m
- retail: Philistine49 m
- restaurant: Descendant49 m
- retail: The Cookery56 m
- restaurant: Dave's Hot Chicken67 m
- retail: 6ix Side Vapes67 m
- retail: Eye Studio69 m
- restaurant: Hanoi 3 Seasons71 m
- cafe: Allwood73 m
- retail77 m
- retail: Timmie's80 m
- restaurant: Domino's81 m
- retail: Wingzilla85 m
- retail: Himalayan Collections87 m
- retail: Bobbette & Belle89 m
- restaurant: Tinga Kim Taqueria92 m
- retail93 m
- retail: Leslieville Kitchens97 m
- retail: Canadian Imaging Solutions99 m
- retail99 m
- restaurant: Goods & Provisions102 m
- restaurant: YAYA Greek Bistro104 m
- retail: Doll Factory by Damzels106 m
- retail: Bronze Home Decor111 m
- restaurant: Nodo115 m
- restaurant: Mini Bar115 m
- restaurant: B & B Fish and Chips120 m
- retail: Simit and chai130 m
- transit stop: Caroline Avenue133 m
- restaurant: Fangio Trattoria136 m
- retail: Berry Bush137 m
- parking lot145 m
- retail: Maude & Art147 m
- retail152 m
- transit stop: Brooklyn Avenue152 m
- restaurant: Pasaj153 m
- cafe: Remarkable Bean158 m
- retail: T & F Auto Repair168 m
- parking lot169 m
- retail: Joseph's Barber & Hairstyling171 m
- retail: Bettencourt Manour176 m
- retail: Kristapsons182 m
- restaurant: Queen's Head Pub186 m
- retail: The Side Kitchen186 m
- retail: Eadry Foods189 m
- cafe: Kidaultland Cafe194 m
- restaurant: The Friendly Thai198 m
Park profile
Five-axis radar across the structural dimensions.
Citywide percentile ranks
Across all Toronto parks in the dataset.
- Overall vitality100th
- Edge activation100th
- Connectivity97th
- Amenity diversity95th
- Natural comfort42th
- Enclosure94th
Most similar parks
Closest in metric space across the five structural dimensions.
- Bellevue Square ParkCivic Square66
- Maple Leaf Forever ParkUrban Plaza61
- Matty Eckler PlaygroundNeighbourhood Park61
- Sonya'S ParkUrban Plaza60
- Graham ParkUrban Plaza59
Most opposite parks
Furthest in metric space. Useful for recognising what kind of park this isn’t.
- Toronto Islands - Muggs Island ParkRavine / Naturalized Park25
- Trca Lands ( 26)Ravine / Naturalized Park27
- Rouge ParkWaterfront Park25
- Rouge ParkRavine / Naturalized Park28
- Rouge ParkRavine / Naturalized Park26
Visitor signals
Public attention measured by Google Places aggregates. This proxies attention, not occupancy. Aggregate-only: no usernames, no review text, no extra photos beyond the cached hero.
p85 citywide · p90 within Parkette
Source: Google Places API · match unverified (0.00 composite confidence) · last refreshed 5/9/2026. Privacy contract. Measures public attention, not occupancy.
Human activity signals: not available
No activity signals have landed for this park yet. The model has scored its physical form but it can’t yet say how often it’s programmed, photographed, or walked through. See /data-ethics for what we will and will not collect.
Does this score feel accurate?
Your read of Leslie Grove Parkmatters. We’re testing whether the model lines up with how people actually use the park. Submissions are stored locally; no account needed.
Tell us how this park feels
We measure structure (canopy, edges, connectivity). You measure feeling. Both matter, and disagreement is itself useful civic data.
What would improve this park?
Generated from the weakest measured dimensions: a starting point, not a prescription.
- Diversify what people can do in the park (playground, washroom, water, shade, performance, sport, garden): even small additions raise this score.
- Increase canopy and reduce paved area. Shade and water features extend usable hours and seasons.
Data sources
- City of Toronto Open Data: Parks (Green Space)Polygon boundaries, official names, types.
- Parks & Recreation FacilitiesInventory of in-park amenities (washrooms, fields, rinks…).
- Toronto Pedestrian NetworkSidewalk segments around and through parks; estimated park entrances.
- Toronto Centreline V2Street segments + intersection nodes near park edges; trails and walkways.
- Toronto 3D MassingBuilding footprints + heights for edge-building counts, frontage density, and tower-in-the-park risk.
- Toronto Treed AreaTree canopy share inside park polygons via stratified-grid sampling.
- Toronto Waterbodies & RiversWater surface inside parks + nearest-water distance for cooling.
- Ravine & Natural Feature ProtectionRavine overlap as a cooling / natural-comfort signal.
- Toronto Street Tree InventoryTree count + density inside park polygons.
- Neighbourhood Profiles(Pending) Equity context proxy.
- OpenStreetMap (Overpass API)Cafés, restaurants, retail, transit stops, parking, highways, rail.