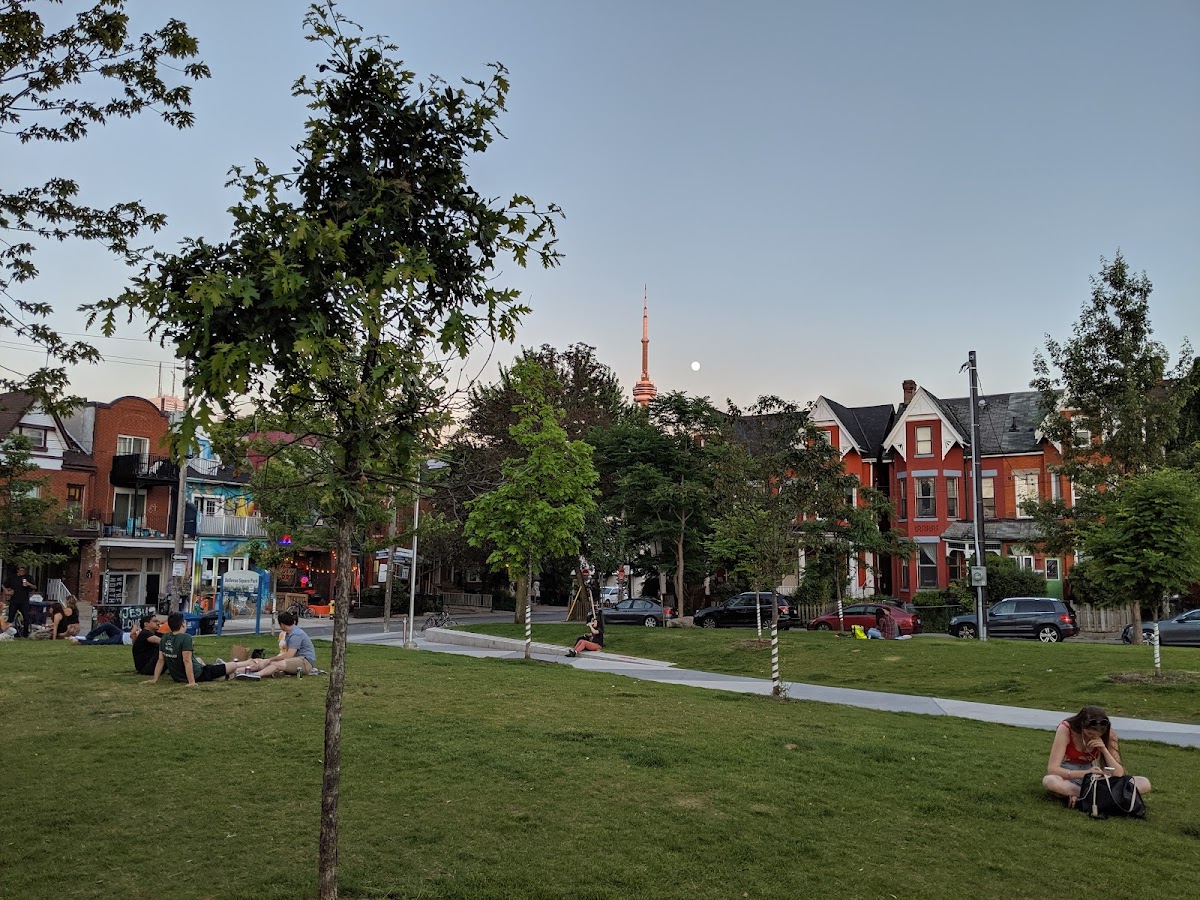
Bellevue Square Park
Civic Square, one of the city's strongest overall (score 66, rank ~100th percentile). Strongest: edge activation; weakest: natural comfort.
Photo by Nick Galanis via Google Places · cached 5/9/2026
Bellevue Square Park scores 66 / 100. Strongest dimensions: edge activation and enclosure / eyes on park. Weakest: amenity diversity (27.3). Border-vacuum risk is low. This score is a transparent reading of Jane Jacobs-style vitality factors, not a definitive judgment.
Area · 0.42 ha
Weighted across six dimensions · confidence 66%
Scores are not bell-curved. Percentiles and expected scores provide context without changing the underlying model.
Loading map…
The parks map is loading.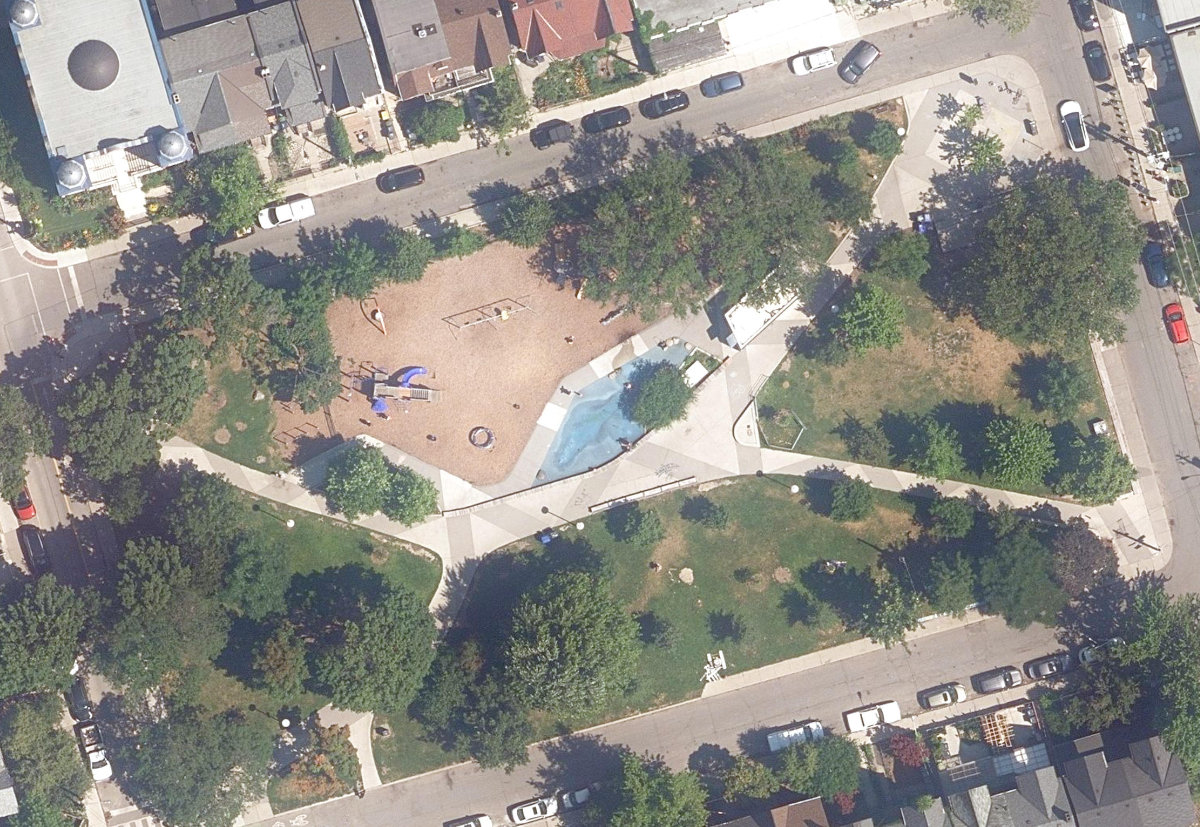
Explain this score
Where did the 66 come from? Each weighted contribution against a neutral 50 baseline. Green = pushed up; red = pulled down.
Sum of contributions = the headline score. A negative bar means that dimension dragged the park below the city-wide neutral baseline.
Why this park works
Bellevue Square Park works because its edge activation score (85) is one of the city's strongest and its connectivity (75) is also top decile (its perimeter is lined with active uses).
What limits this park
Bellevue Square Park doesn't have a clear weakness. Every measured dimension is at or above the middle of the pack.
Most distinctive characteristic
Most distinctive feature: exceptionally high edge activation (85, top decile).
Jacobs reading
Bellevue Square Park sits between an urban social park and an ecological retreat: moderately useful for both, exceptionally suited to neither.
Tradeoffs
- Connectivity (75) significantly outpaces natural comfort (42): well placed in the city but offers little shade or ecological respite.
Performance in context
- This park is a strong overperformer for its cohort: raw 66 versus an expected 42 for similar parks (small Civic Square) (gap +24).
Typology classification
Classified as Civic Square: name flags as civic square + 82 buildings frame the edge. Secondary read: Urban Plaza (4176 m², paved (0% canopy), 30.0 buildings/100 m).
Edge Activation
Within 100 m of the park edge: 33 active uses (restaurant, cafe, retail) and 0 dead/hostile uses (none). Active edges keep "eyes on the park" through the day; parking lots, blank institutional walls, rail and highway frontages drain street life.
Source: OSM POIs (amenity/shop) + Toronto Building Footprints + land use
Connectivity
Connectivity blends paths, intersections, transit, entrances, and edge density. This park has 13 mapped paths/walkways and 13 sidewalk segments within 50 m; 24 street intersections within 100 m; 18 transit stops within a 400 m walk; 5 estimated access points across ~273 m of perimeter. edge density is healthy, no superblock penalty. Source coverage: centreline, pedestrian_network, transit_osm.
Source: Toronto Centreline V2 + Pedestrian Network + OSM transit stops
Amenity Diversity
3 distinct amenity types in the park (fitness, playground, washroom). Diversity, not raw count, drives the score so a park with many distinct activity types can outrank a larger park that repeats the same use.
Source: Toronto Parks & Recreation Facilities + OSM amenity tags
Natural Comfort
Natural-comfort components for this park: ~9.8% effective canopy (0.0% from contiguous tree polygons + scattered tree density); 14 city-mapped trees inside the polygon (14.0/ha). Reading: exposed. Source coverage: street_trees. Impervious surface is approximated (Toronto's authoritative layer ships only as a raster GeoTIFF).
Source: Toronto Treed Area + Ravine + Waterbodies + Street Tree Inventory
Enclosure / Eyes on Park
82 buildings within 25 m of the park edge (8 mid-rise, 74 low-rise, 0 tower); avg edge height 7.0 m (~2 floors); 30.0 buildings per 100 m of 273 m perimeter (strong frontage density); edges are low-rise (mostly 2 to 3 floors); no towers immediately adjacent. "Eyes on the park" come strongest from the 8 mid-rise edge buildings.
Source: Toronto 3D Massing (building footprints + heights)
Border Vacuum Risk
Park edges face the city. No significant border vacuum detected.
Source: Toronto Street Centreline (highways) + rail layer + OSM landuse + building footprints
Equity Context
Equity Context requires inputs not yet loaded for this park (Toronto Neighbourhood Profiles). Score is held at a neutral 50 with low confidence. Read with caution.
Source: Toronto Neighbourhood Profiles
Amenities (3 types · 3 records)
- fitness
- playground
- washroom
Nearby active-edge features (80)
- retail: Sasmart17 m
- restaurant: Burdock Brewery18 m
- restaurant: Fresco's Fish & Chips22 m
- restaurant: Arepazo23 m
- restaurant: Egg Bae23 m
- retail: Kid Icarus27 m
- restaurant: Pizzeria Via Mercanti28 m
- restaurant: Knockout Chicken28 m
- restaurant: Rikki Tikki31 m
- retail: Carlos House of Spice37 m
- restaurant: King's Café50 m
- retail: CAAM United Hardware52 m
- restaurant: The Boat54 m
- retail: Upside Cyclestyle55 m
- restaurant: The Embassy55 m
- restaurant: Hungary Thai59 m
- restaurant: Gus Tacos60 m
- retail64 m
- restaurant: Pancho y Emiliano69 m
- retail: Longboard Living76 m
- restaurant: Handlebar79 m
- restaurant: ugly delicious80 m
- retail: Gallery 7885 m
- retail: Flaming Vintage88 m
- restaurant: Legenda88 m
- retail: Hooked90 m
- retail: Vida92 m
- retail: Inky Dinky92 m
- restaurant: The Suya Spot94 m
- cafe: Jimmy's Coffee94 m
- restaurant: Lekker96 m
- retail: Natural Foods97 m
- retail: Latin Taste97 m
- retail: Sea Kings102 m
- retail: Space Vintage103 m
- retail: Fong on Foods103 m
- retail: One Plant104 m
- retail: Butterfly104 m
- retail: Vintage Dépôt104 m
- retail: Lost Boys Vintage105 m
- cafe: Lola105 m
- retail: Essence of Life105 m
- cafe: Fika Cafe106 m
- retail: Seven Seas Fish Market107 m
- retail: Stay Polish108 m
- retail: Golden Patty108 m
- retail: Sweet Hart Kitchen109 m
- retail: The Pearl109 m
- retail: Kensington Variety109 m
- retail: Brimz110 m
- retail: Cocktail Emporium110 m
- retail: Exile112 m
- retail: Sub Rosa Vintage113 m
- retail: Nutty Frutty113 m
- retail: Tom's Place114 m
- retail: Bazar114 m
- retail: Courage my love115 m
- retail: Vintage Depot117 m
- restaurant: Mare Pizzeria118 m
- retail: Harry David LTD118 m
- restaurant: Last Temptation118 m
- restaurant: Seven Lives Tacos Y Mariscos119 m
- restaurant: Seven Lives Tacos120 m
- retail: Urban Catwalk122 m
- retail: Ride House123 m
- restaurant: Jumbo Empanadas123 m
- restaurant: Greens Vegetarian Restaurant123 m
- restaurant: Poetry Jazz Cafe124 m
- retail: African Drums & Art Crafts124 m
- retail: Global Cheese125 m
- cafe: Tibet Cafe125 m
- restaurant: rasta pasta127 m
- retail: Mosaic World127 m
- retail: Paranoid127 m
- retail: Kensington Leather128 m
- retail: 6x8 Market128 m
- retail: Fruit Mart130 m
- cafe: Sleepy Pete's130 m
- retail: Portugal Auto Garage130 m
- retail: Daniel Safety Workwear Ltd.130 m
Park profile
Five-axis radar across the structural dimensions.
Citywide percentile ranks
Across all Toronto parks in the dataset.
- Overall vitality100th
- Edge activation100th
- Connectivity96th
- Amenity diversity92th
- Natural comfort42th
- Enclosure85th
Most similar parks
Closest in metric space across the five structural dimensions.
- Leslie Grove ParkParkette68
- Matty Eckler PlaygroundNeighbourhood Park61
- Maple Leaf Forever ParkUrban Plaza61
- Graham ParkUrban Plaza59
- Arena GardensUrban Plaza58
Most opposite parks
Furthest in metric space. Useful for recognising what kind of park this isn’t.
- Trca Lands ( 26)Ravine / Naturalized Park27
- Toronto Islands - Muggs Island ParkRavine / Naturalized Park25
- Rouge ParkRavine / Naturalized Park28
- Rouge ParkWaterfront Park25
- Rouge ParkRavine / Naturalized Park26
Visitor signals
Public attention measured by Google Places aggregates. This proxies attention, not occupancy. Aggregate-only: no usernames, no review text, no extra photos beyond the cached hero.
“Small green space with a playground, wading pool & bronze statue of local actor/director Al Waxman.” (Google editorial summary)
p95 citywide · p86 within Civic Square
Source: Google Places API · match unverified (0.00 composite confidence) · last refreshed 5/9/2026. Privacy contract. Measures public attention, not occupancy.
Human activity signals: not available
No activity signals have landed for this park yet. The model has scored its physical form but it can’t yet say how often it’s programmed, photographed, or walked through. See /data-ethics for what we will and will not collect.
Does this score feel accurate?
Your read of Bellevue Square Parkmatters. We’re testing whether the model lines up with how people actually use the park. Submissions are stored locally; no account needed.
Tell us how this park feels
We measure structure (canopy, edges, connectivity). You measure feeling. Both matter, and disagreement is itself useful civic data.
What would improve this park?
Generated from the weakest measured dimensions: a starting point, not a prescription.
- Diversify what people can do in the park (playground, washroom, water, shade, performance, sport, garden): even small additions raise this score.
- Increase canopy and reduce paved area. Shade and water features extend usable hours and seasons.
Data sources
- City of Toronto Open Data: Parks (Green Space)Polygon boundaries, official names, types.
- Parks & Recreation FacilitiesInventory of in-park amenities (washrooms, fields, rinks…).
- Toronto Pedestrian NetworkSidewalk segments around and through parks; estimated park entrances.
- Toronto Centreline V2Street segments + intersection nodes near park edges; trails and walkways.
- Toronto 3D MassingBuilding footprints + heights for edge-building counts, frontage density, and tower-in-the-park risk.
- Toronto Treed AreaTree canopy share inside park polygons via stratified-grid sampling.
- Toronto Waterbodies & RiversWater surface inside parks + nearest-water distance for cooling.
- Ravine & Natural Feature ProtectionRavine overlap as a cooling / natural-comfort signal.
- Toronto Street Tree InventoryTree count + density inside park polygons.
- Neighbourhood Profiles(Pending) Equity context proxy.
- OpenStreetMap (Overpass API)Cafés, restaurants, retail, transit stops, parking, highways, rail.