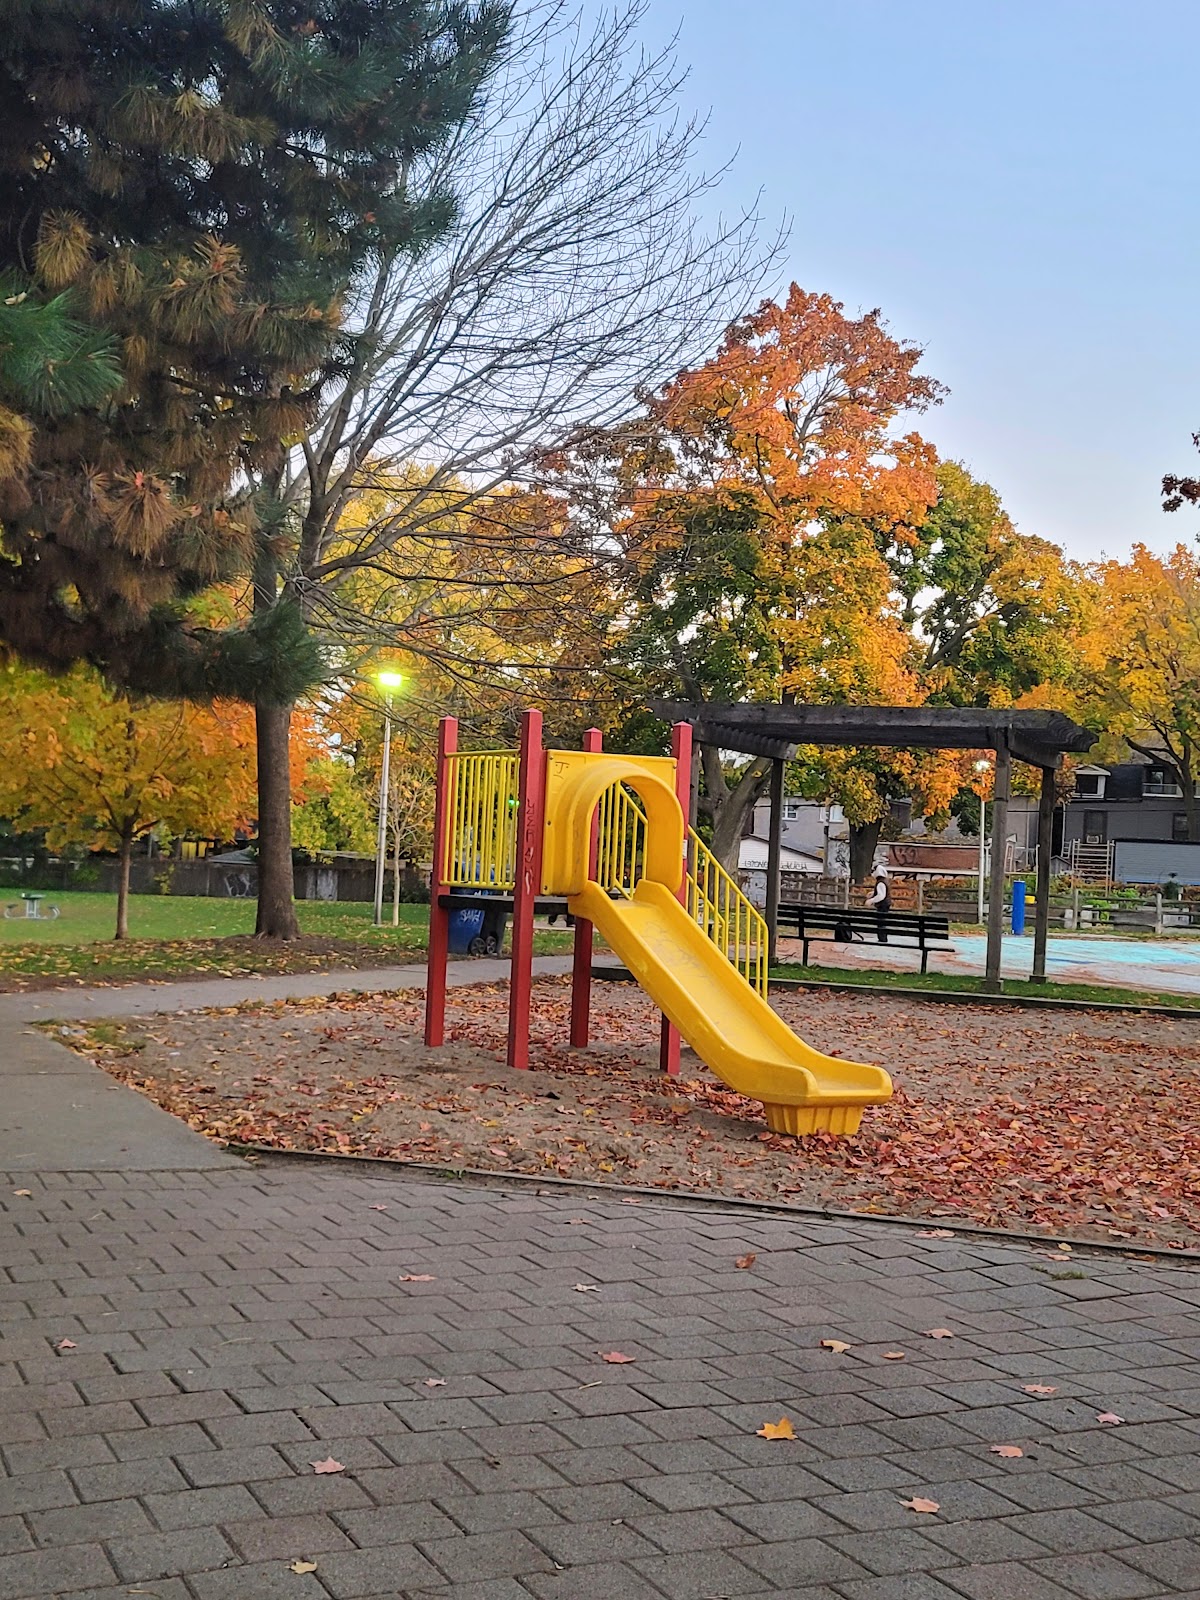
Matty Eckler Playground
Neighbourhood Park, one of the city's strongest overall (score 61, rank ~100th percentile). Strongest: edge activation; weakest: natural comfort.
Photo by Chen XueLin via Google Places · cached 5/9/2026
Matty Eckler Playground scores 61 / 100. Strongest dimensions: enclosure / eyes on park and connectivity. Weakest: amenity diversity (28.4). Border-vacuum risk is low. This score is a transparent reading of Jane Jacobs-style vitality factors, not a definitive judgment.
Area · 1.13 ha
Weighted across six dimensions · confidence 68%
Scores are not bell-curved. Percentiles and expected scores provide context without changing the underlying model.
Loading map…
The parks map is loading.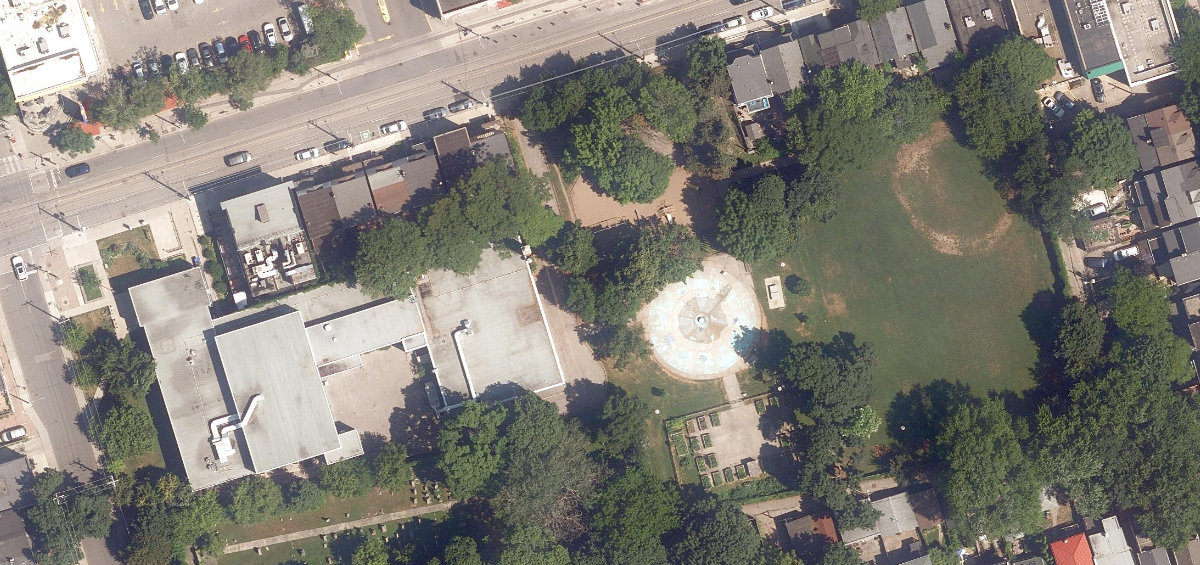
Explain this score
Where did the 61 come from? Each weighted contribution against a neutral 50 baseline. Green = pushed up; red = pulled down.
Sum of contributions = the headline score. A negative bar means that dimension dragged the park below the city-wide neutral baseline.
Why this park works
Matty Eckler Playground works because its edge activation score (70) is one of the city's strongest and its amenity diversity (28) is also top decile (its perimeter is lined with active uses).
What limits this park
Matty Eckler Playground is held back by natural comfort (36, below-average): only 0% canopy means little summer shade.
Most distinctive characteristic
Most distinctive feature: exceptionally high edge activation (70, top decile).
Jacobs reading
Matty Eckler Playground sits between an urban social park and an ecological retreat: moderately useful for both, exceptionally suited to neither.
Tradeoffs
- Connectivity (71) significantly outpaces natural comfort (36): well placed in the city but offers little shade or ecological respite.
Performance in context
- This park is a strong overperformer for its cohort: raw 61 versus an expected 37 for similar parks (medium Neighbourhood Park) (gap +24).
Typology classification
Classified as Neighbourhood Park: 1.1 ha, framed by 17 mid-rise vs 0 towers
Edge Activation
Within 100 m of the park edge: 37 active uses (transit_stop, restaurant, retail, cafe) and 2 dead/hostile uses (parking_lot). Active edges keep "eyes on the park" through the day; parking lots, blank institutional walls, rail and highway frontages drain street life.
Source: OSM POIs (amenity/shop) + Toronto Building Footprints + land use
Connectivity
Connectivity blends paths, intersections, transit, entrances, and edge density. This park has 10 mapped paths/walkways and 21 sidewalk segments within 50 m; 18 street intersections within 100 m; 29 transit stops within a 400 m walk; 2 estimated access points across ~577 m of perimeter. edge density is healthy, no superblock penalty. Source coverage: centreline, pedestrian_network, transit_osm.
Source: Toronto Centreline V2 + Pedestrian Network + OSM transit stops
Amenity Diversity
3 distinct amenity types in the park (community_centre, playground, tennis). Diversity, not raw count, drives the score so a park with many distinct activity types can outrank a larger park that repeats the same use.
Source: Toronto Parks & Recreation Facilities + OSM amenity tags
Natural Comfort
Natural-comfort components for this park: ~4.3% effective canopy (0.0% from contiguous tree polygons + scattered tree density); nearest waterbody ~1430 m; 7 city-mapped trees inside the polygon (6.2/ha). Reading: exposed. Source coverage: waterbodies, street_trees. Impervious surface is approximated (Toronto's authoritative layer ships only as a raster GeoTIFF).
Source: Toronto Treed Area + Ravine + Waterbodies + Street Tree Inventory
Enclosure / Eyes on Park
110 buildings within 25 m of the park edge (17 mid-rise, 93 low-rise, 0 tower); avg edge height 7.6 m (~3 floors); 19.1 buildings per 100 m of 577 m perimeter (strong frontage density); edges are low-rise (mostly 2 to 3 floors); no towers immediately adjacent. "Eyes on the park" come strongest from the 17 mid-rise edge buildings.
Source: Toronto 3D Massing (building footprints + heights)
Border Vacuum Risk
Park edges face the city. No significant border vacuum detected.
Source: Toronto Street Centreline (highways) + rail layer + OSM landuse + building footprints
Equity Context
Equity Context requires inputs not yet loaded for this park (Toronto Neighbourhood Profiles). Score is held at a neutral 50 with low confidence. Read with caution.
Source: Toronto Neighbourhood Profiles
Amenities (3 types · 3 records)
- community centre
- playground
- tennis
Nearby active-edge features (80)
- restaurant: Maple Leaf Tavern6 m
- transit stop: Pape Avenue12 m
- transit stop: Pape Avenue19 m
- retail: Riverside Fabrics23 m
- restaurant: Pizza Pide28 m
- restaurant: Little Caesars28 m
- cafe: Tim Hortons28 m
- retail: 18 K Mutts28 m
- retail: Freedom Mobile30 m
- transit stop: Pape Avenue31 m
- transit stop: Marjory Avenue40 m
- retail: Cash 4 You45 m
- retail: Josie's Lock and Key49 m
- parking lot51 m
- retail: Oriental Hair Salon54 m
- cafe: CoCo Fresh Tea & Juice55 m
- restaurant: Nganda59 m
- retail: Italy Hair Design64 m
- transit stop: Marjory Avenue65 m
- retail: Tech Source66 m
- retail: Two Cats Cannabis Co.66 m
- restaurant: 241 Pizza67 m
- restaurant: Pho Com Tam 168 Vietnamese Cuisines68 m
- transit stop: Marjory Avenue69 m
- parking lot70 m
- retail72 m
- restaurant: Poor Romeo77 m
- restaurant: GB Hand-Pulled Noodles78 m
- restaurant: Pinkeryon's Snack Bar81 m
- restaurant: Los Cantaritos87 m
- retail: Philippine Oriental Food Market88 m
- retail: T-Shirt Factory90 m
- retail: Value Mobile;Lifestyle Healthcare90 m
- retail: Guo Jewellery92 m
- retail: Gateway Newstands93 m
- retail95 m
- retail: Absolute Dollar97 m
- retail: Society97 m
- retail: Beddington's99 m
- retail: Blanca Shoes103 m
- parking lot104 m
- retail: Bilin Jewellery109 m
- retail: Nails for You110 m
- retail: Nature's Health Food117 m
- retail: Gateway Lotto117 m
- retail: Cellular X118 m
- retail: Advance Opticians118 m
- retail: Fido119 m
- cafe: Dineen Outpost122 m
- rail: Kingston Subdivision122 m
- retail: Les Bagages123 m
- retail: Staples126 m
- rail: Kingston Subdivision126 m
- retail: Kin Kin Bakery129 m
- retail: Telus130 m
- retail: Sunrise Beauty Supply132 m
- retail: Top Cuts133 m
- retail: The Source133 m
- retail: Fashion World133 m
- retail: Foot Locker140 m
- restaurant: Blackjack BBQ142 m
- retail: Bluenotes142 m
- retail: Winners142 m
- retail: Little London Barbershop143 m
- retail: EB Games146 m
- retail: Ardene146 m
- restaurant: Huy Ky147 m
- restaurant: Vatican Gift Shop147 m
- restaurant: Lonch Sushi149 m
- retail: Bell150 m
- retail: Oscar's Coin Laundry153 m
- restaurant: La Greeka153 m
- cafe: Real Fruit Bubble Tea156 m
- restaurant: Asian Gourmet157 m
- retail: Labels159 m
- restaurant: KFC165 m
- retail168 m
- restaurant: BarBurrito168 m
- restaurant: Subway171 m
- retail: Angel Nails173 m
Park profile
Five-axis radar across the structural dimensions.
Citywide percentile ranks
Across all Toronto parks in the dataset.
- Overall vitality100th
- Edge activation99th
- Connectivity92th
- Amenity diversity94th
- Natural comfort28th
- Enclosure86th
Most similar parks
Closest in metric space across the five structural dimensions.
- Stanley Park South - TorontoAthletic / Recreation Park60
- Bellevue Square ParkCivic Square66
- James Canning GardensUrban Plaza58
- Arena GardensUrban Plaza58
- Grange ParkNeighbourhood Park60
Most opposite parks
Furthest in metric space. Useful for recognising what kind of park this isn’t.
- Trca Lands ( 26)Ravine / Naturalized Park27
- Toronto Islands - Muggs Island ParkRavine / Naturalized Park25
- Rouge ParkRavine / Naturalized Park28
- Rouge ParkWaterfront Park25
- Rouge ParkRavine / Naturalized Park26
Visitor signals
Public attention measured by Google Places aggregates. This proxies attention, not occupancy. Aggregate-only: no usernames, no review text, no extra photos beyond the cached hero.
p25 citywide · p25 within Neighbourhood Park
Source: Google Places API · match unverified (0.00 composite confidence) · last refreshed 5/9/2026. Privacy contract. Measures public attention, not occupancy.
Human activity signals: not available
No activity signals have landed for this park yet. The model has scored its physical form but it can’t yet say how often it’s programmed, photographed, or walked through. See /data-ethics for what we will and will not collect.
Does this score feel accurate?
Your read of Matty Eckler Playgroundmatters. We’re testing whether the model lines up with how people actually use the park. Submissions are stored locally; no account needed.
Tell us how this park feels
We measure structure (canopy, edges, connectivity). You measure feeling. Both matter, and disagreement is itself useful civic data.
What would improve this park?
Generated from the weakest measured dimensions: a starting point, not a prescription.
- Diversify what people can do in the park (playground, washroom, water, shade, performance, sport, garden): even small additions raise this score.
- Increase canopy and reduce paved area. Shade and water features extend usable hours and seasons.
Data sources
- City of Toronto Open Data: Parks (Green Space)Polygon boundaries, official names, types.
- Parks & Recreation FacilitiesInventory of in-park amenities (washrooms, fields, rinks…).
- Toronto Pedestrian NetworkSidewalk segments around and through parks; estimated park entrances.
- Toronto Centreline V2Street segments + intersection nodes near park edges; trails and walkways.
- Toronto 3D MassingBuilding footprints + heights for edge-building counts, frontage density, and tower-in-the-park risk.
- Toronto Treed AreaTree canopy share inside park polygons via stratified-grid sampling.
- Toronto Waterbodies & RiversWater surface inside parks + nearest-water distance for cooling.
- Ravine & Natural Feature ProtectionRavine overlap as a cooling / natural-comfort signal.
- Toronto Street Tree InventoryTree count + density inside park polygons.
- Neighbourhood Profiles(Pending) Equity context proxy.
- OpenStreetMap (Overpass API)Cafés, restaurants, retail, transit stops, parking, highways, rail.