Sonya'S Park
Urban Plaza, one of the city's strongest overall (score 60, rank ~100th percentile). Strongest: edge activation; weakest: natural comfort.
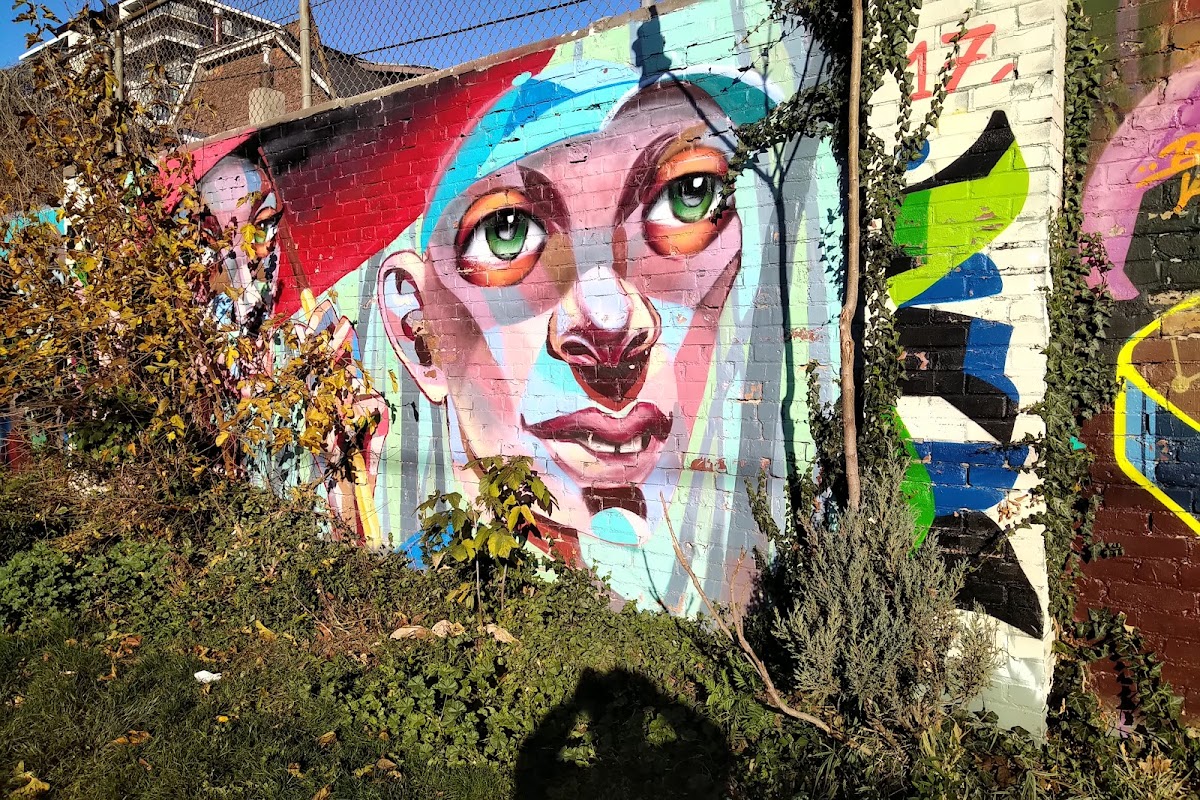
Photo by Geoff Haha via Google Places · cached 5/9/2026
Sonya'S Park scores 60.1 / 100. Strongest dimensions: enclosure / eyes on park and edge activation. Weakest: amenity diversity (11.9). Border-vacuum risk is low. This score is a transparent reading of Jane Jacobs-style vitality factors, not a definitive judgment.
Area · 0.06 ha
Weighted across six dimensions · confidence 65%
Scores are not bell-curved. Percentiles and expected scores provide context without changing the underlying model.
Loading map…
The parks map is loading.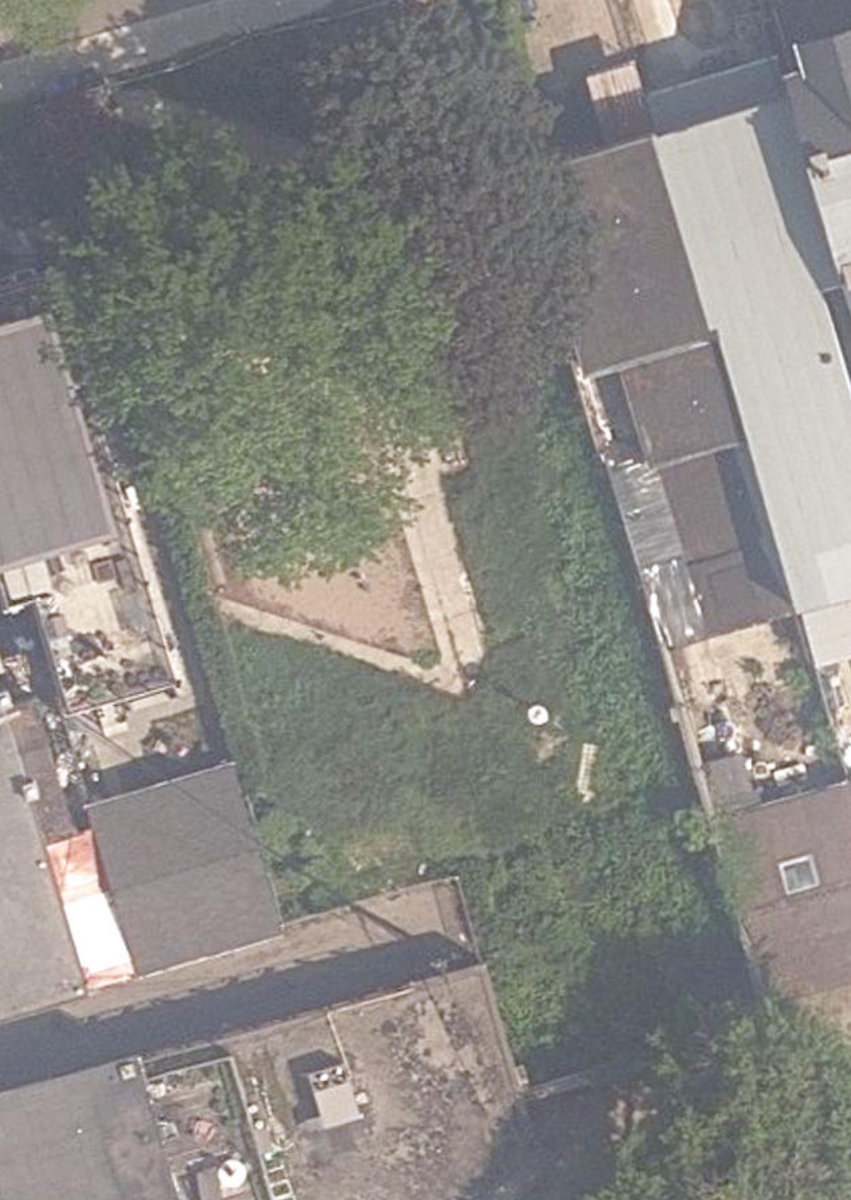
Explain this score
Where did the 60 come from? Each weighted contribution against a neutral 50 baseline. Green = pushed up; red = pulled down.
Sum of contributions = the headline score. A negative bar means that dimension dragged the park below the city-wide neutral baseline.
Why this park works
Sonya'S Park works because its edge activation score (84) is one of the city's strongest and its enclosure (89) is also top decile (its perimeter is lined with active uses).
What limits this park
Sonya'S Park is held back by natural comfort (32, bottom quartile): only 0% canopy means little summer shade.
Most distinctive characteristic
Most distinctive feature: exceptionally high edge activation (84, top decile).
Jacobs reading
Sonya'S Park sits between an urban social park and an ecological retreat: moderately useful for both, exceptionally suited to neither.
Tradeoffs
- Connectivity (65) significantly outpaces natural comfort (32): well placed in the city but offers little shade or ecological respite.
Performance in context
- This park is a strong overperformer for its cohort: raw 60 versus an expected 36 for similar parks (pocket Urban Plaza) (gap +24).
Typology classification
Classified as Urban Plaza: 627 m², paved (0% canopy), 73.8 buildings/100 m
Edge Activation
Within 100 m of the park edge: 32 active uses (retail, restaurant, cafe) and 0 dead/hostile uses (none). Active edges keep "eyes on the park" through the day; parking lots, blank institutional walls, rail and highway frontages drain street life.
Source: OSM POIs (amenity/shop) + Toronto Building Footprints + land use
Connectivity
Connectivity blends paths, intersections, transit, entrances, and edge density. This park has 5 mapped paths/walkways and 10 sidewalk segments within 50 m; 9 street intersections within 100 m; 11 transit stops within a 400 m walk; 2 estimated access points across ~113 m of perimeter. edge density is healthy, no superblock penalty. Source coverage: centreline, pedestrian_network, transit_osm.
Source: Toronto Centreline V2 + Pedestrian Network + OSM transit stops
Amenity Diversity
1 distinct amenity types in the park (playground). Diversity, not raw count, drives the score so a park with many distinct activity types can outrank a larger park that repeats the same use.
Source: Toronto Parks & Recreation Facilities + OSM amenity tags
Natural Comfort
Natural-comfort components for this park: ~1.4% effective canopy (0.0% from contiguous tree polygons + scattered tree density); 2 city-mapped trees inside the polygon (2.0/ha). Reading: exposed. Source coverage: street_trees. Impervious surface is approximated (Toronto's authoritative layer ships only as a raster GeoTIFF).
Source: Toronto Treed Area + Ravine + Waterbodies + Street Tree Inventory
Enclosure / Eyes on Park
83 buildings within 25 m of the park edge (16 mid-rise, 67 low-rise, 0 tower); avg edge height 7.6 m (~3 floors); 73.8 buildings per 100 m of 113 m perimeter (strong frontage density); edges are low-rise (mostly 2 to 3 floors); no towers immediately adjacent. "Eyes on the park" come strongest from the 16 mid-rise edge buildings.
Source: Toronto 3D Massing (building footprints + heights)
Border Vacuum Risk
Park edges face the city. No significant border vacuum detected.
Source: Toronto Street Centreline (highways) + rail layer + OSM landuse + building footprints
Equity Context
Equity Context requires inputs not yet loaded for this park (Toronto Neighbourhood Profiles). Score is held at a neutral 50 with low confidence. Read with caution.
Source: Toronto Neighbourhood Profiles
Amenities (1 types · 1 records)
- playground
Nearby active-edge features (80)
- restaurant: Big Fat Burrito23 m
- retail: Bungalow24 m
- restaurant: The Burgernator/Kensington Market24 m
- retail25 m
- retail: Model Citizen25 m
- restaurant: Birria Catrina29 m
- cafe: Rick's Cafe30 m
- retail: Sugar and Spice30 m
- restaurant: Wanda's Pie in the Sky33 m
- retail: Come As You Are49 m
- retail: Public Butter51 m
- cafe: The Arch Café52 m
- restaurant: The Cottage Cheese54 m
- retail: bungalow west55 m
- retail: NU Bügel57 m
- restaurant: Trinity Common61 m
- cafe: Hibiscus Vegan Cafe66 m
- restaurant: Dolce Gelato67 m
- retail: Oxford Fruit68 m
- restaurant: Otto's Berlin Döner69 m
- restaurant: Ozzy's Burgers Toronto73 m
- restaurant: Pizzaria Da Mario75 m
- cafe: Cafe Pamenar78 m
- restaurant: Eative Film Cafe80 m
- cafe: Krepesz Cafe & Bar81 m
- retail: Bikes on Wheels84 m
- restaurant: Eative87 m
- retail90 m
- restaurant: Supermarket91 m
- restaurant: Ronnie's Local 06991 m
- retail: Daniel Safety Workwear Ltd.95 m
- restaurant: Jumbo Empanadas95 m
- retail: Bluebird Laser Hair Removal101 m
- parking lot101 m
- restaurant: Poetry Jazz Cafe102 m
- retail: Paul's Boutique104 m
- retail: Harry David LTD106 m
- restaurant: Toritos Tapas Bar108 m
- retail: One Plant114 m
- parking lot114 m
- cafe: Harmony Cafe115 m
- restaurant: Mango Like Desserts120 m
- restaurant: Lekker121 m
- retail: 6x8 Market126 m
- retail: Seven Seas Fish Market126 m
- parking lot126 m
- retail: Natural Foods126 m
- retail: Tom's Place127 m
- retail: Latin Taste127 m
- restaurant: The Suya Spot128 m
- retail: Pet Valu128 m
- retail: Inky Dinky128 m
- restaurant128 m
- retail: Hooked128 m
- retail: Cheese Magic129 m
- restaurant: Legenda130 m
- retail: Sam's Food Stores130 m
- restaurant: Leaf Doner130 m
- cafe: I deal coffee130 m
- retail: One Heart131 m
- restaurant: Tacos 101132 m
- retail: House of Vapes135 m
- parking lot136 m
- retail: Sanagan's Meat Locker137 m
- parking lot139 m
- restaurant: Valentina139 m
- restaurant: Nora140 m
- retail: Aion Amor140 m
- retail: Little Island Comics140 m
- retail: mango mango140 m
- retail: The Beguiling141 m
- retail: S&K cleaners141 m
- retail: Blackbird Baking Co142 m
- retail: Flaming Vintage143 m
- retail: Gallery 78143 m
- retail: Vida143 m
- cafe: Jimmy's Coffee143 m
- retail: Sea Kings143 m
- retail: Golden Patty144 m
- restaurant: ugly delicious145 m
Park profile
Five-axis radar across the structural dimensions.
Citywide percentile ranks
Across all Toronto parks in the dataset.
- Overall vitality100th
- Edge activation100th
- Connectivity82th
- Amenity diversity78th
- Natural comfort15th
- Enclosure95th
Most similar parks
Closest in metric space across the five structural dimensions.
- Maple Leaf Forever ParkUrban Plaza61
- Graham ParkUrban Plaza59
- Grace - College ParketteCorridor / Linear Park59
- Graham ParkUrban Plaza54
- Arena GardensUrban Plaza58
Most opposite parks
Furthest in metric space. Useful for recognising what kind of park this isn’t.
- Trca Lands ( 26)Ravine / Naturalized Park27
- Toronto Islands - Muggs Island ParkRavine / Naturalized Park25
- Rouge ParkRavine / Naturalized Park28
- Rouge ParkWaterfront Park25
- Rouge ParkRavine / Naturalized Park26
Visitor signals
Public attention measured by Google Places aggregates. This proxies attention, not occupancy. Aggregate-only: no usernames, no review text, no extra photos beyond the cached hero.
p65 citywide · p68 within Urban Plaza
Source: Google Places API · match unverified (0.00 composite confidence) · last refreshed 5/9/2026. Privacy contract. Measures public attention, not occupancy.
Human activity signals: not available
No activity signals have landed for this park yet. The model has scored its physical form but it can’t yet say how often it’s programmed, photographed, or walked through. See /data-ethics for what we will and will not collect.
Does this score feel accurate?
Your read of Sonya'S Parkmatters. We’re testing whether the model lines up with how people actually use the park. Submissions are stored locally; no account needed.
Tell us how this park feels
We measure structure (canopy, edges, connectivity). You measure feeling. Both matter, and disagreement is itself useful civic data.
What would improve this park?
Generated from the weakest measured dimensions: a starting point, not a prescription.
- Diversify what people can do in the park (playground, washroom, water, shade, performance, sport, garden): even small additions raise this score.
- Increase canopy and reduce paved area. Shade and water features extend usable hours and seasons.
Data sources
- City of Toronto Open Data: Parks (Green Space)Polygon boundaries, official names, types.
- Parks & Recreation FacilitiesInventory of in-park amenities (washrooms, fields, rinks…).
- Toronto Pedestrian NetworkSidewalk segments around and through parks; estimated park entrances.
- Toronto Centreline V2Street segments + intersection nodes near park edges; trails and walkways.
- Toronto 3D MassingBuilding footprints + heights for edge-building counts, frontage density, and tower-in-the-park risk.
- Toronto Treed AreaTree canopy share inside park polygons via stratified-grid sampling.
- Toronto Waterbodies & RiversWater surface inside parks + nearest-water distance for cooling.
- Ravine & Natural Feature ProtectionRavine overlap as a cooling / natural-comfort signal.
- Toronto Street Tree InventoryTree count + density inside park polygons.
- Neighbourhood Profiles(Pending) Equity context proxy.
- OpenStreetMap (Overpass API)Cafés, restaurants, retail, transit stops, parking, highways, rail.