Atlas Observatory: Comparison Tool
Analyze the morphological and ecological vitality of Toronto's public realm. Select up to three parks to view side-by-side data visualizations and qualitative urban-DNA profiles.
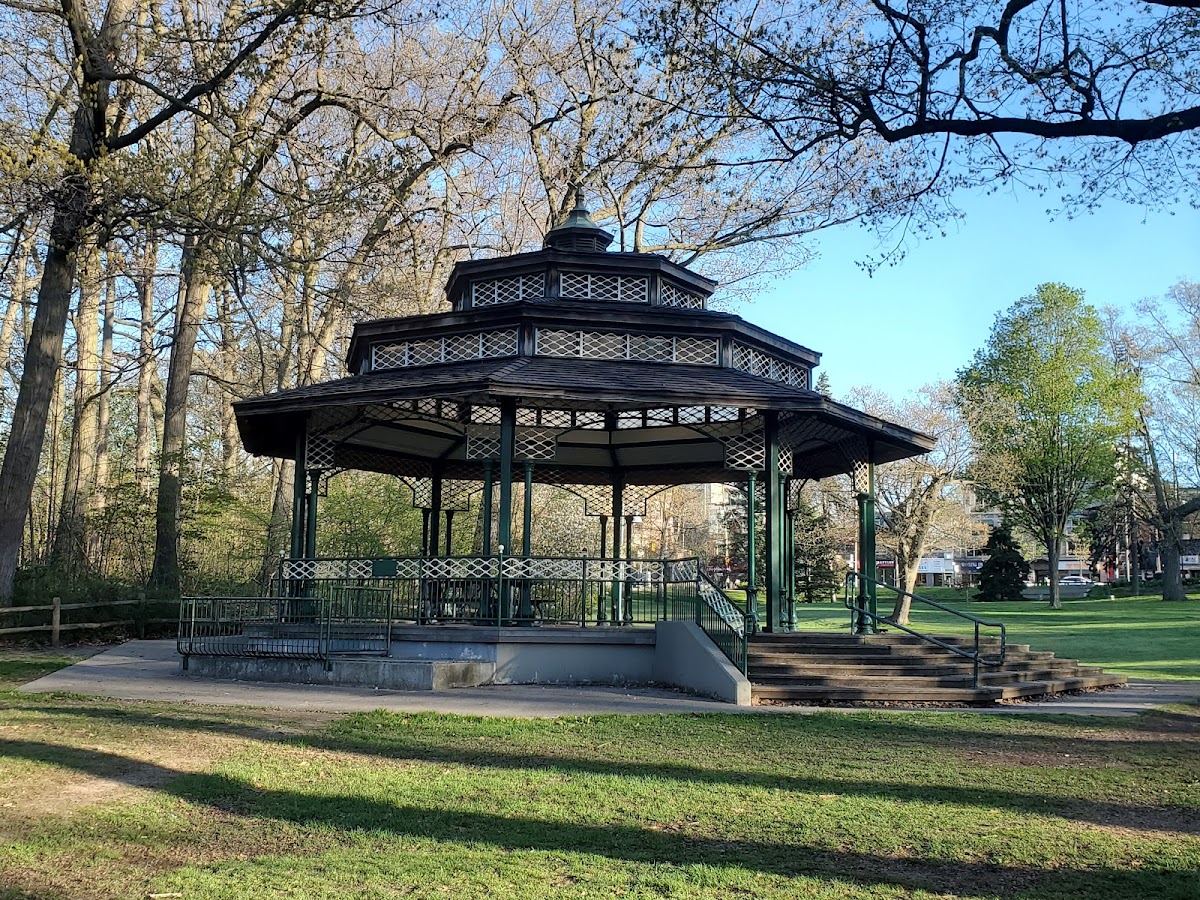
Kew Gardens
Vitality Score
7.1/10
Data Confidence
TypologyNeighbourhood Park
NeighbourhoodThe Beaches (63)
Strongest dimensionEdge activation · 81
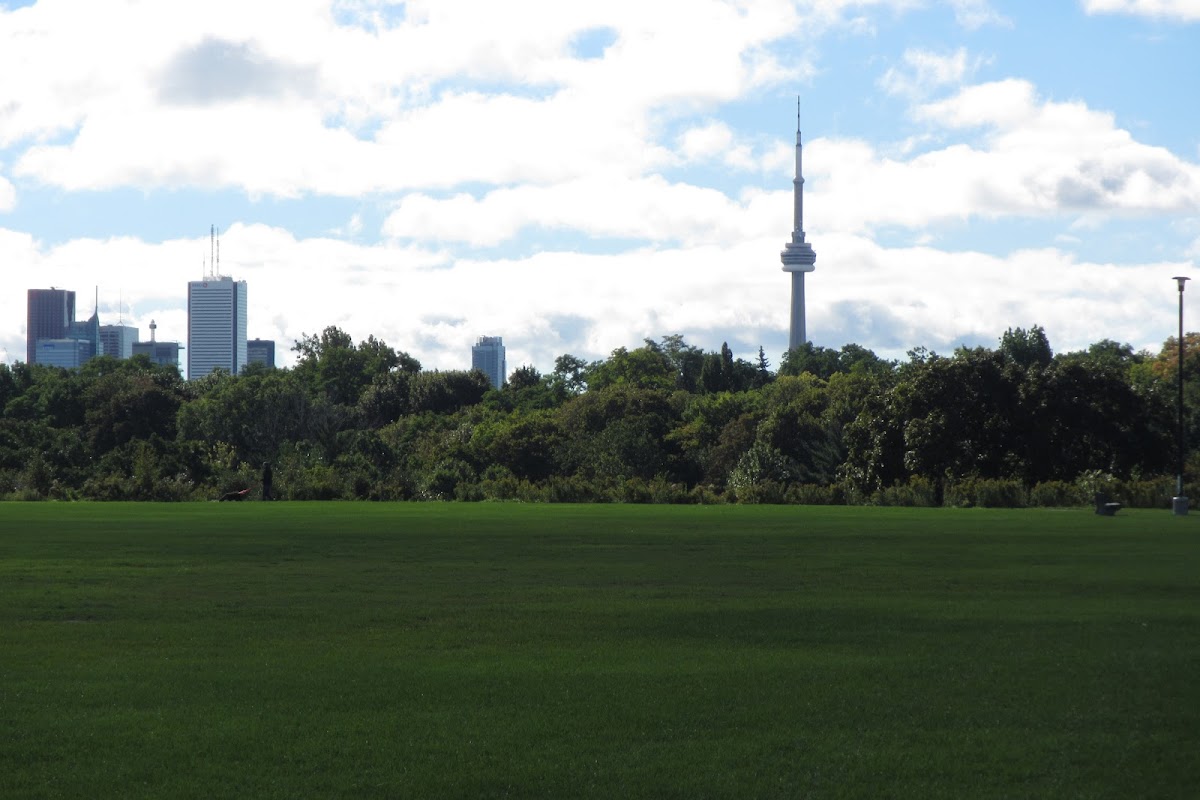
Sir Winston Churchill Park
Vitality Score
6.9/10
Data Confidence
TypologyRavine / Naturalized Park
NeighbourhoodCasa Loma (96)
Strongest dimensionEnclosure · 87
Profile overlay
Five-axis radar across edge activation, connectivity, amenity diversity, natural comfort, and enclosure.
Urban DNA Analysis
| Metric | Kew Gardens | Sir Winston Churchill Park |
|---|---|---|
| Edge activation | 81 / 100 | 70 / 100 |
| Connectivity | 79 / 100 | 83 / 100 |
| Amenity diversity | 44 / 100 | 35 / 100 |
| Natural comfort | 65 / 100 | 64 / 100 |
| Enclosure | 77 / 100 | 87 / 100 |
| Border-vacuum risk (lower is better) | 12 / 100 | 0 / 100 |
| Area | 7.90 ha | 8.69 ha |
| Confidence | 72% | 72% |
| Citywide percentile | 100th | 100th |
| Typology percentile | 100th | 100th |
| Expected (similar parks) | 35 / 100 | 36 / 100 |
| Performance gap | +37 · strong overperformer | +33 · strong overperformer |
Synthesized Comparison
Two civic registers, comparable strength
Kew Gardens currently scores 71 / 100, with its strongest signal in edge activation. This is a Neighbourhood Park. Read its full breakdown for tradeoffs.
Sir Winston Churchill Park scores 69 / 100. Its leading dimension is enclosure. The gap of 2points reflects what each park is asked to do, not which is "better."