Military Cemetery
Parkette, near the bottom of the city overall (score 25, rank ~11th percentile). Strongest: connectivity; weakest: enclosure.
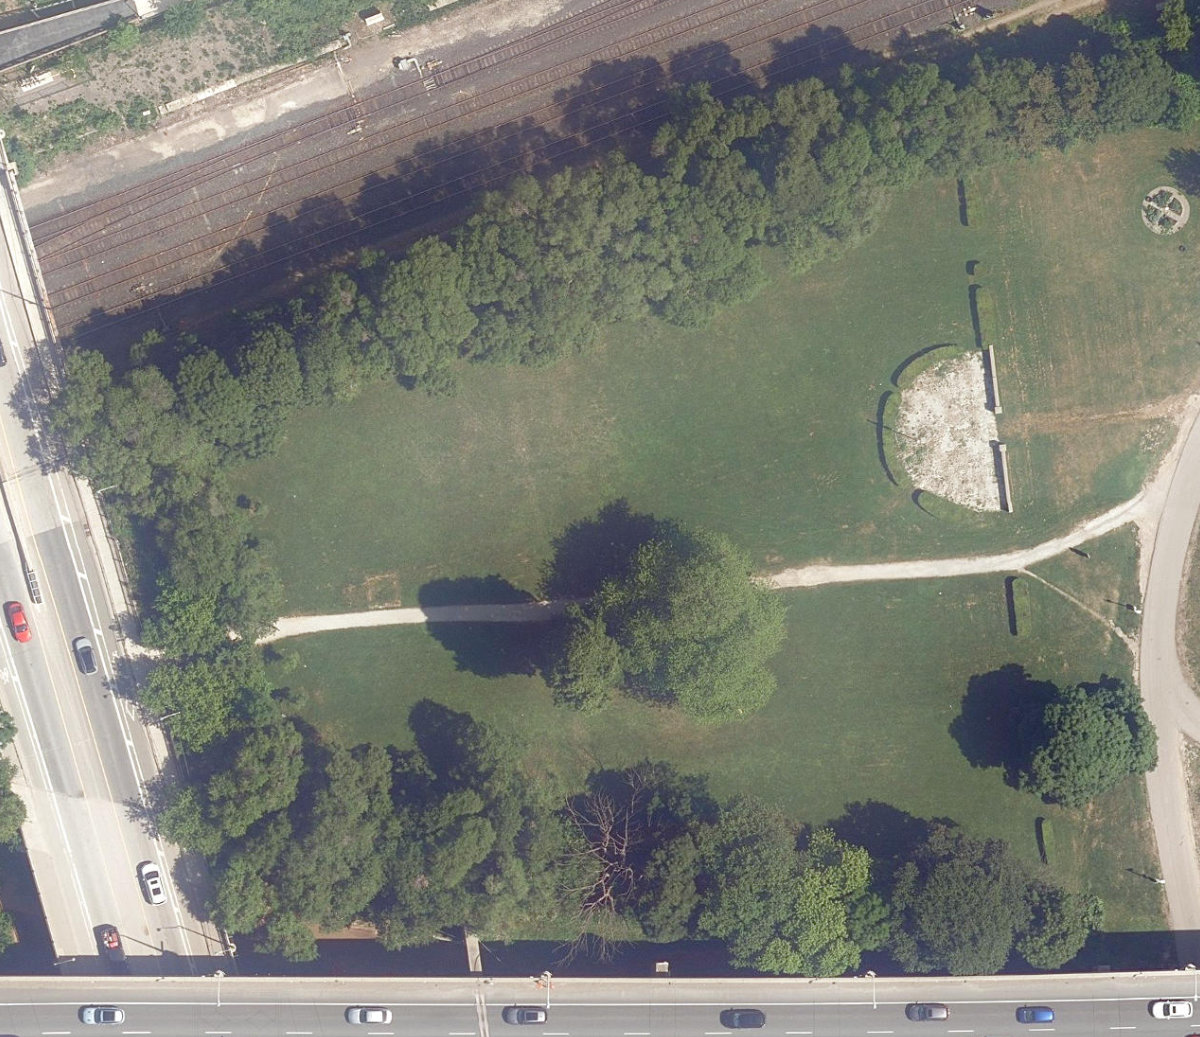
Aerial, City of Toronto orthophoto, ~8 cm/px source · cached 5/9/2026
Military Cemetery scores 24.7 / 100. Strongest dimensions: connectivity and enclosure / eyes on park. Weakest: amenity diversity (0). Border-vacuum risk is elevated (100). This score is a transparent reading of Jane Jacobs-style vitality factors, not a definitive judgment.
Area · 0.74 ha
Weighted across six dimensions · confidence 63%
Scores are not bell-curved. Percentiles and expected scores provide context without changing the underlying model.
Loading map…
The parks map is loading.Explain this score
Where did the 25 come from? Each weighted contribution against a neutral 50 baseline. Green = pushed up; red = pulled down.
Sum of contributions = the headline score. A negative bar means that dimension dragged the park below the city-wide neutral baseline.
Why this park works
Military Cemetery works because its connectivity score (66) is above average (17 transit stops sit within a 400 m walk; 10 intersections fall within 100 m of the edge).
What limits this park
Military Cemetery is held back by enclosure (54, bottom quartile); border-vacuum risk is also elevated (100).
Most distinctive characteristic
Most distinctive feature: exceptionally high connectivity (66, top quartile).
Jacobs reading
Military Cemetery is currently underperforming on both axes: neither integrated into the city nor offering deep natural respite. A candidate for design intervention.
Tradeoffs
- Connectivity (66) significantly outpaces natural comfort (41): well placed in the city but offers little shade or ecological respite.
- 7 nearby towers cast wind and shadow without contributing canopy: passive surveillance is plentiful but human-scale comfort is not.
- High connectivity coexists with high border-vacuum risk (100): much of that connectivity is to highways, rail, or parking lots, not to neighbourhoods.
Performance in context
- Reads as a modest underperformer relative to comparable parks (gap -11; cohort: small Parkette).
Typology classification
Classified as Parkette: small (7431 m²) with strong building frontage (4.2 per 100 m)
Edge Activation
Within 100 m of the park edge: 0 active uses (none) and 13 dead/hostile uses (rail, parking_lot). Active edges keep "eyes on the park" through the day; parking lots, blank institutional walls, rail and highway frontages drain street life.
Source: OSM POIs (amenity/shop) + Toronto Building Footprints + land use
Connectivity
Connectivity blends paths, intersections, transit, entrances, and edge density. This park has 17 mapped paths/walkways and 5 sidewalk segments within 50 m; 10 street intersections within 100 m; 17 transit stops within a 400 m walk; 2 estimated access points across ~358 m of perimeter. edge density is healthy, no superblock penalty. Source coverage: centreline, pedestrian_network, transit_osm.
Source: Toronto Centreline V2 + Pedestrian Network + OSM transit stops
Amenity Diversity
No amenities recorded. Score is 0 until inventory is loaded.
Source: Toronto Parks & Recreation Facilities + OSM amenity tags
Natural Comfort
Natural-comfort components for this park: 3.8% estimated tree canopy; nearest waterbody ~564 m. Reading: exposed. Source coverage: treed_area, waterbodies. Impervious surface is approximated (Toronto's authoritative layer ships only as a raster GeoTIFF).
Source: Toronto Treed Area + Ravine + Waterbodies + Street Tree Inventory
Enclosure / Eyes on Park
15 buildings within 25 m of the park edge (7 mid-rise, 1 low-rise, 7 tower); avg edge height 49.7 m (~17 floors); 4.2 buildings per 100 m of 358 m perimeter (strong frontage density); edges dominated by towers; 7 towers ≥ 40 m within 25 m of the edge. "Eyes on the park" come strongest from the 7 mid-rise edge buildings.
Source: Toronto 3D Massing (building footprints + heights)
Border Vacuum Risk
Border-vacuum factors within 50 m of the park: rail, Oakville Subdivision, rail, Oakville Subdivision, rail, Oakville Subdivision, Oakville Subdivision, Oakville Subdivision. Jacobs warned that highways, rail, parking lots and blank institutional edges act as "vacuums" that suppress foot traffic and isolate the park from its neighbourhood.
Source: Toronto Street Centreline (highways) + rail layer + OSM landuse + building footprints
Equity Context
Equity Context requires inputs not yet loaded for this park (Toronto Neighbourhood Profiles). Score is held at a neutral 50 with low confidence. Read with caution.
Source: Toronto Neighbourhood Profiles
Amenities (0)
No amenities recorded for this park.
Nearby active-edge features (42)
- rail: Oakville Subdivision12 m
- rail: Oakville Subdivision16 m
- rail22 m
- rail: Oakville Subdivision24 m
- rail30 m
- rail: Oakville Subdivision41 m
- rail: Oakville Subdivision43 m
- rail45 m
- parking lot70 m
- parking lot79 m
- rail82 m
- rail: Oakville Subdivision91 m
- rail: Oakville Subdivision95 m
- retail: Wine Rack109 m
- cafe: Starbucks110 m
- rail: Oakville Subdivision111 m
- parking lot112 m
- parking lot117 m
- parking lot118 m
- rail: Oakville Subdivision122 m
- restaurant: Forest Hill Farmhouse122 m
- transit stop: Fleet Street128 m
- highway: Gardiner Expressway129 m
- transit stop: Fleet Street143 m
- retail: Vent Blow Dry Bar158 m
- rail: Oakville Subdivision159 m
- parking lot162 m
- rail: Oakville Subdivision163 m
- rail163 m
- rail: Oakville Subdivision164 m
- highway: Gardiner Expressway168 m
- transit stop: Strachan Avenue171 m
- transit stop: Manitoba Dr at Strachan Ave West Side172 m
- transit stop: Fleet St at Strachan Ave173 m
- transit stop: Strachan Avenue174 m
- transit stop: Fleet St at Fort York Blvd West Side175 m
- rail: Oakville Subdivision179 m
- rail: Union Station Rail Corridor181 m
- rail: Western Lead183 m
- rail: Union Station Rail Corridor184 m
- parking lot188 m
- transit stop: Fleet Street193 m
Park profile
Five-axis radar across the structural dimensions.
Citywide percentile ranks
Across all Toronto parks in the dataset.
- Overall vitality11th
- Edge activation44th
- Connectivity84th
- Amenity diversity49th
- Natural comfort38th
- Enclosure18th
Most similar parks
Closest in metric space across the five structural dimensions.
- Wilson Heights GreenNeighbourhood Park24
- East Highland Creek WatercourseRavine / Naturalized Park33
- Wexford HydroNeighbourhood Park31
- Old Fort YorkCorridor / Linear Park25
- West Highland Creek WatercourseWaterfront Park35
Most opposite parks
Furthest in metric space. Useful for recognising what kind of park this isn’t.
- Leslie Grove ParkParkette68
- Kew GardensNeighbourhood Park71
- Market Lane ParkUrban Plaza63
- Joseph Burr Tyrrell ParkUrban Plaza50
- Manor Community GreenUrban Plaza57
Human activity signals: not available
No activity signals have landed for this park yet. The model has scored its physical form but it can’t yet say how often it’s programmed, photographed, or walked through. See /data-ethics for what we will and will not collect.
Does this score feel accurate?
Your read of Military Cemeterymatters. We’re testing whether the model lines up with how people actually use the park. Submissions are stored locally; no account needed.
Tell us how this park feels
We measure structure (canopy, edges, connectivity). You measure feeling. Both matter, and disagreement is itself useful civic data.
What would improve this park?
Generated from the weakest measured dimensions: a starting point, not a prescription.
- Activate the edges: encourage cafés, retail or community uses on the streets that face the park; replace blank or parking-lot edges where possible.
- Diversify what people can do in the park (playground, washroom, water, shade, performance, sport, garden): even small additions raise this score.
- Increase canopy and reduce paved area. Shade and water features extend usable hours and seasons.
- Mitigate border vacuums (highways, rail, parking) with active programming on the still-permeable edges and treat the hostile edge as a design challenge.
Data sources
- City of Toronto Open Data: Parks (Green Space)Polygon boundaries, official names, types.
- Parks & Recreation FacilitiesInventory of in-park amenities (washrooms, fields, rinks…).
- Toronto Pedestrian NetworkSidewalk segments around and through parks; estimated park entrances.
- Toronto Centreline V2Street segments + intersection nodes near park edges; trails and walkways.
- Toronto 3D MassingBuilding footprints + heights for edge-building counts, frontage density, and tower-in-the-park risk.
- Toronto Treed AreaTree canopy share inside park polygons via stratified-grid sampling.
- Toronto Waterbodies & RiversWater surface inside parks + nearest-water distance for cooling.
- Ravine & Natural Feature ProtectionRavine overlap as a cooling / natural-comfort signal.
- Toronto Street Tree InventoryTree count + density inside park polygons.
- Neighbourhood Profiles(Pending) Equity context proxy.
- OpenStreetMap (Overpass API)Cafés, restaurants, retail, transit stops, parking, highways, rail.