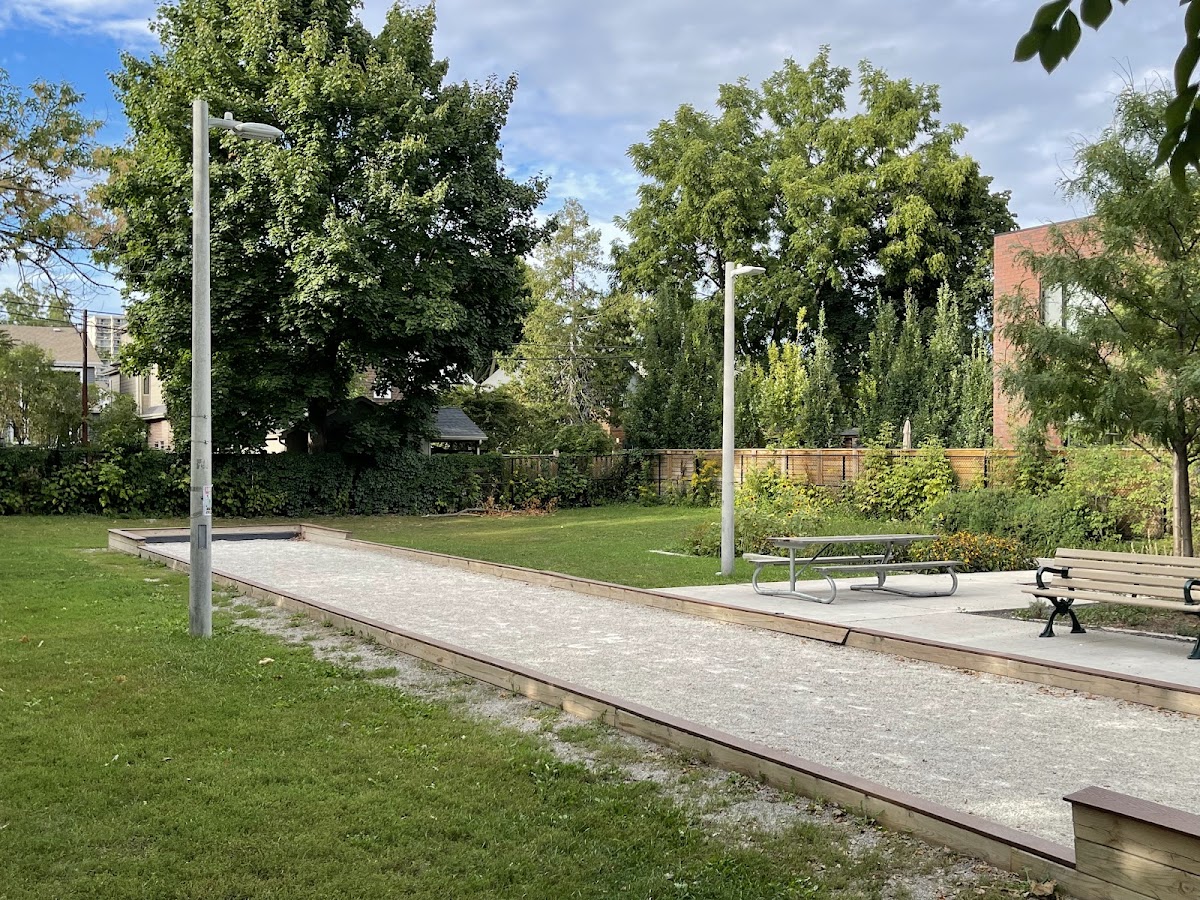
Manor Community Green
Urban Plaza, one of the city's strongest overall (score 57, rank ~99th percentile). Strongest: edge activation; weakest: connectivity.
Photo by Keven Menager via Google Places · cached 5/9/2026
Manor Community Green scores 56.9 / 100. Strongest dimensions: edge activation and enclosure / eyes on park. Weakest: amenity diversity (0). Border-vacuum risk is low. This score is a transparent reading of Jane Jacobs-style vitality factors, not a definitive judgment.
Area · 0.11 ha
Weighted across six dimensions · confidence 61%
Scores are not bell-curved. Percentiles and expected scores provide context without changing the underlying model.
Loading map…
The parks map is loading.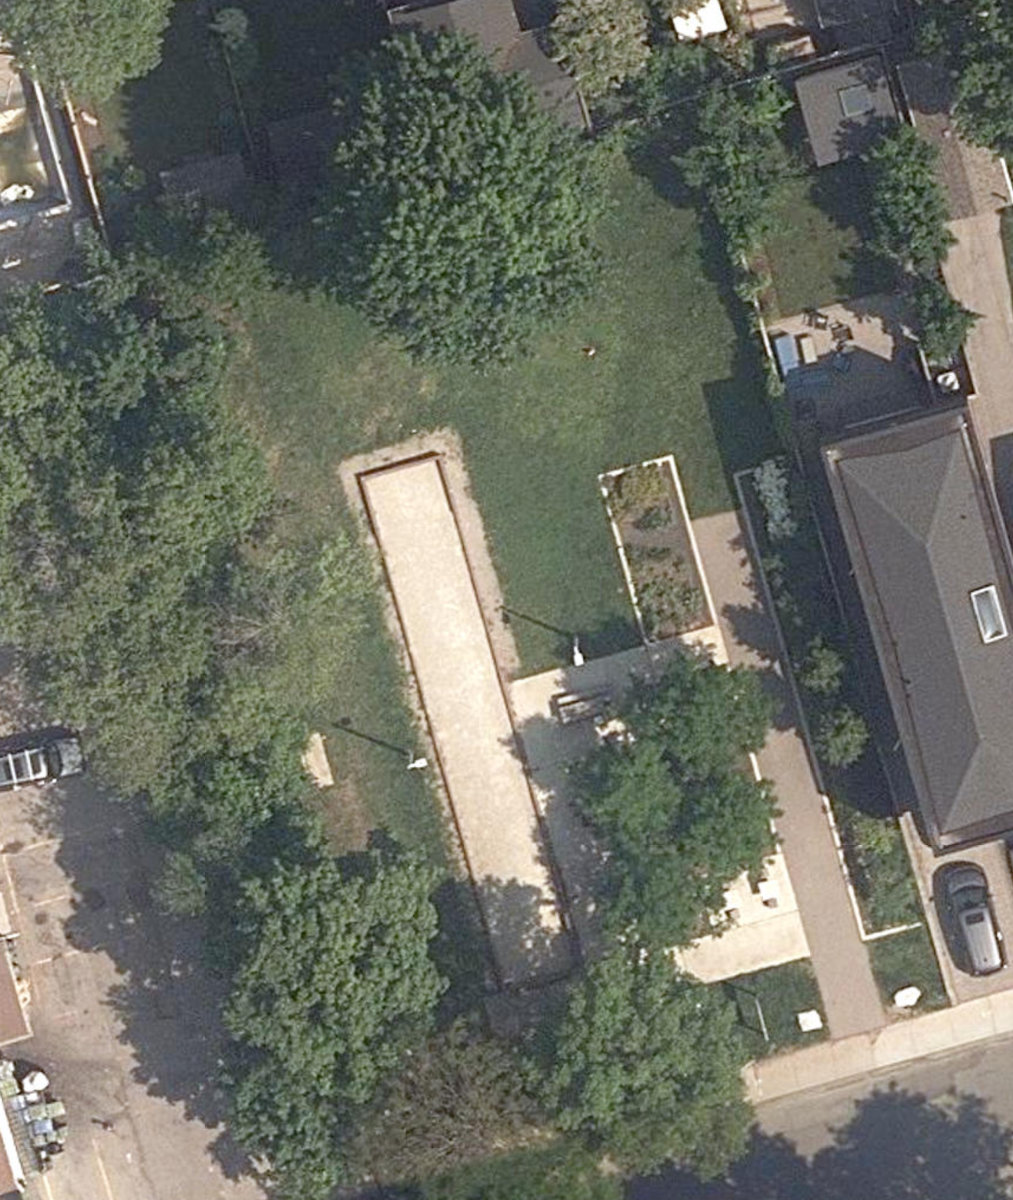
Explain this score
Where did the 57 come from? Each weighted contribution against a neutral 50 baseline. Green = pushed up; red = pulled down.
Sum of contributions = the headline score. A negative bar means that dimension dragged the park below the city-wide neutral baseline.
Why this park works
Manor Community Green works because its edge activation score (87) is one of the city's strongest and its enclosure (85) is also top decile (its perimeter is lined with active uses).
What limits this park
Manor Community Green doesn't have a clear weakness. Every measured dimension is at or above the middle of the pack.
Most distinctive characteristic
Most distinctive feature: exceptionally high edge activation (87, top decile).
Jacobs reading
Manor Community Green is a balanced hybrid: strong urban integration (72) and meaningful natural comfort (65). Rare in the Toronto Park Catalogue.
Performance in context
- This park is a strong overperformer for its cohort: raw 57 versus an expected 36 for similar parks (pocket Urban Plaza) (gap +21).
Typology classification
Classified as Urban Plaza: 1138 m², paved (13% canopy), 48.4 buildings/100 m
Edge Activation
Within 100 m of the park edge: 40 active uses (transit_stop, cafe, retail, restaurant, community) and 0 dead/hostile uses (none). Active edges keep "eyes on the park" through the day; parking lots, blank institutional walls, rail and highway frontages drain street life.
Source: OSM POIs (amenity/shop) + Toronto Building Footprints + land use
Connectivity
Connectivity blends paths, intersections, transit, entrances, and edge density. This park has 0 mapped paths/walkways and 11 sidewalk segments within 50 m; 4 street intersections within 100 m; 6 transit stops within a 400 m walk; 0 estimated access points across ~136 m of perimeter. edge density is healthy, no superblock penalty. Source coverage: centreline, pedestrian_network, transit_osm.
Source: Toronto Centreline V2 + Pedestrian Network + OSM transit stops
Amenity Diversity
No amenities recorded. Score is 0 until inventory is loaded.
Source: Toronto Parks & Recreation Facilities + OSM amenity tags
Natural Comfort
Natural-comfort components for this park: 12.5% estimated tree canopy; nearest waterbody ~1211 m. Reading: exposed. Source coverage: treed_area, waterbodies. Impervious surface is approximated (Toronto's authoritative layer ships only as a raster GeoTIFF).
Source: Toronto Treed Area + Ravine + Waterbodies + Street Tree Inventory
Enclosure / Eyes on Park
66 buildings within 25 m of the park edge (7 mid-rise, 59 low-rise, 0 tower); avg edge height 7.2 m (~2 floors); 48.4 buildings per 100 m of 136 m perimeter (strong frontage density); edges are low-rise (mostly 2 to 3 floors); no towers immediately adjacent. "Eyes on the park" come strongest from the 7 mid-rise edge buildings.
Source: Toronto 3D Massing (building footprints + heights)
Border Vacuum Risk
Park edges face the city. No significant border vacuum detected.
Source: Toronto Street Centreline (highways) + rail layer + OSM landuse + building footprints
Equity Context
Equity Context requires inputs not yet loaded for this park (Toronto Neighbourhood Profiles). Score is held at a neutral 50 with low confidence. Read with caution.
Source: Toronto Neighbourhood Profiles
Amenities (0)
No amenities recorded for this park.
Nearby active-edge features (80)
- retail: Apricot Flowers28 m
- retail: It’s Tea28 m
- retail: Mastermind Toys29 m
- restaurant: Positano Restaurant30 m
- retail: Laura Stein Interiors31 m
- retail: Penwarden Fine Jewellery32 m
- restaurant: Phebe's Zee Grill33 m
- retail: Wish List YYZ33 m
- cafe: Thobors Café34 m
- restaurant: Yukashi36 m
- retail: New Manor Convenience37 m
- restaurant: Chokka Persian Cuisine39 m
- retail41 m
- retail: Spa42 m
- transit stop: Manor Road East44 m
- retail: Jules Cafe Patisserie44 m
- retail: Fogtown48 m
- restaurant: Pizza Nova52 m
- transit stop: Manor Road East57 m
- retail: Maison Nurita60 m
- community: Toronto Public Library - Mount Pleasant67 m
- retail: Rosedale Kennedy Flowers67 m
- retail: Snapdragon69 m
- retail: Little White Sneakers71 m
- cafe: Daphne’s Antioch Café Breakfast & Lunch71 m
- retail: Piujut Gallery72 m
- retail: B. T. Nail74 m
- restaurant: XO Gelato74 m
- retail: Inhabit Books78 m
- retail: Alexandre Antique Prints, Maps & Books80 m
- retail: Olive Oil Emporium80 m
- retail: Kempik Fine Bulk Food80 m
- retail: Unbox your Party81 m
- retail: Toronto Bath Center84 m
- retail: Pleasant Nails86 m
- retail: The Manor Boutique Salon91 m
- retail: Vanessa's Nails & Spa93 m
- restaurant: Shibui Sushi95 m
- retail: Periwinkle Flowers96 m
- retail: Collected Joy98 m
- retail: Closets by Design101 m
- restaurant: Domaine Mamo101 m
- retail: Cia Concept Store103 m
- retail: Foxies Bakeshop105 m
- restaurant: Florentia Italian Ristorante106 m
- retail: Dove Depot Cleaners107 m
- retail: White Rabbit Cannabis108 m
- retail: Davisville Kitchens112 m
- retail: Rewind112 m
- retail: Caribou Gifts116 m
- restaurant: Boland's Open Kitchen117 m
- retail: Season Fruit House118 m
- retail: Night & Day Window Decor122 m
- retail: Amoria Medspa Clinic122 m
- retail: David Austin Hair124 m
- retail: Elle Hair Studio126 m
- retail: Uberdog Mount Pleasant126 m
- retail: Fine Custom Dry Cleaners127 m
- retail: Candy's Costume Shop129 m
- retail: Jacaranda Tree & Co.132 m
- cafe: At Origin Cafe134 m
- retail: Green Natural Health and Nutrition Centre140 m
- retail: Helene Clarkson141 m
- retail: The Massage Therapy Boutique145 m
- transit stop: Soudan Avenue146 m
- retail: Royal Antiques Rug Gallery146 m
- retail: Flirty Flutters Lash & Brow147 m
- retail: World of Repair Rugs149 m
- retail: Frame Master159 m
- cafe: Starbucks161 m
- restaurant: Instant Du Palais164 m
- retail: Livingstone & Co.165 m
- retail: Elly Amar Studio169 m
- retail: Dry Clean Alterations171 m
- retail: Louis Shoe Repair172 m
- restaurant: Pizza Pizza174 m
- retail: Durant Sessions174 m
- transit stop: Soudan Avenue179 m
- retail: Rivo’s Barbershop179 m
- retail: Brentview Electronics184 m
Park profile
Five-axis radar across the structural dimensions.
Citywide percentile ranks
Across all Toronto parks in the dataset.
- Overall vitality99th
- Edge activation100th
- Connectivity46th
- Amenity diversity56th
- Natural comfort61th
- Enclosure90th
Most similar parks
Closest in metric space across the five structural dimensions.
- Ryerson Community ParkUrban Plaza60
- Market Lane ParkUrban Plaza63
- Wembley ParketteUrban Plaza50
- Bernard Avenue Road AllowanceUrban Plaza54
- Shaw St Traffic Median SouthCorridor / Linear Park52
Most opposite parks
Furthest in metric space. Useful for recognising what kind of park this isn’t.
- Toronto Islands - Muggs Island ParkRavine / Naturalized Park25
- Rouge ParkWaterfront Park25
- Trca Lands ( 26)Ravine / Naturalized Park27
- Rouge ParkRavine / Naturalized Park28
- Rouge ParkRavine / Naturalized Park21
Visitor signals
Public attention measured by Google Places aggregates. This proxies attention, not occupancy. Aggregate-only: no usernames, no review text, no extra photos beyond the cached hero.
p61 citywide · p59 within Urban Plaza
Source: Google Places API · match unverified (0.00 composite confidence) · last refreshed 5/9/2026. Privacy contract. Measures public attention, not occupancy.
Human activity signals: not available
No activity signals have landed for this park yet. The model has scored its physical form but it can’t yet say how often it’s programmed, photographed, or walked through. See /data-ethics for what we will and will not collect.
Does this score feel accurate?
Your read of Manor Community Greenmatters. We’re testing whether the model lines up with how people actually use the park. Submissions are stored locally; no account needed.
Tell us how this park feels
We measure structure (canopy, edges, connectivity). You measure feeling. Both matter, and disagreement is itself useful civic data.
What would improve this park?
Generated from the weakest measured dimensions: a starting point, not a prescription.
- Add or open more entrances and improve sidewalk continuity around the park. More permeability means more spontaneous use.
- Diversify what people can do in the park (playground, washroom, water, shade, performance, sport, garden): even small additions raise this score.
Data sources
- City of Toronto Open Data: Parks (Green Space)Polygon boundaries, official names, types.
- Parks & Recreation FacilitiesInventory of in-park amenities (washrooms, fields, rinks…).
- Toronto Pedestrian NetworkSidewalk segments around and through parks; estimated park entrances.
- Toronto Centreline V2Street segments + intersection nodes near park edges; trails and walkways.
- Toronto 3D MassingBuilding footprints + heights for edge-building counts, frontage density, and tower-in-the-park risk.
- Toronto Treed AreaTree canopy share inside park polygons via stratified-grid sampling.
- Toronto Waterbodies & RiversWater surface inside parks + nearest-water distance for cooling.
- Ravine & Natural Feature ProtectionRavine overlap as a cooling / natural-comfort signal.
- Toronto Street Tree InventoryTree count + density inside park polygons.
- Neighbourhood Profiles(Pending) Equity context proxy.
- OpenStreetMap (Overpass API)Cafés, restaurants, retail, transit stops, parking, highways, rail.