Old Fort York
Corridor / Linear Park, near the bottom of the city overall (score 25, rank ~13th percentile). Strongest: connectivity; weakest: edge activation.
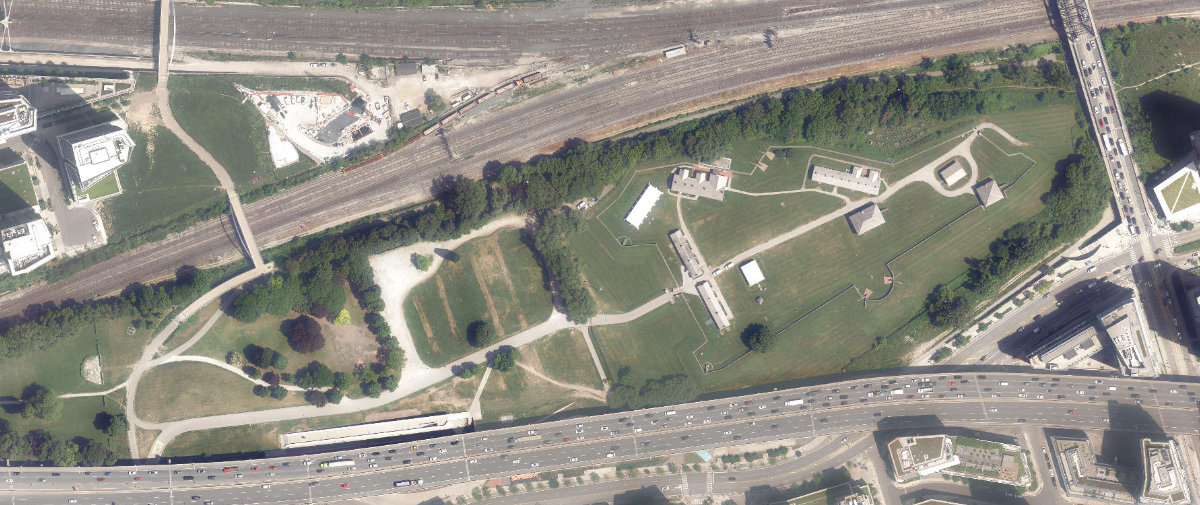
Aerial, City of Toronto orthophoto, ~8 cm/px source · cached 5/9/2026
Old Fort York scores 25.3 / 100. Strongest dimensions: connectivity and enclosure / eyes on park. Weakest: amenity diversity (0). Border-vacuum risk is elevated (100). This score is a transparent reading of Jane Jacobs-style vitality factors, not a definitive judgment.
Area · 6.30 ha
Weighted across six dimensions · confidence 59%
Scores are not bell-curved. Percentiles and expected scores provide context without changing the underlying model.
Loading map…
The parks map is loading.Explain this score
Where did the 25 come from? Each weighted contribution against a neutral 50 baseline. Green = pushed up; red = pulled down.
Sum of contributions = the headline score. A negative bar means that dimension dragged the park below the city-wide neutral baseline.
Why this park works
Old Fort York works because its connectivity score (67) is in the top tier (28 transit stops sit within a 400 m walk; 17 intersections fall within 100 m of the edge).
What limits this park
Old Fort York is held back by edge activation (0, bottom quartile): the surrounding streets carry too few active uses to spill into the park; border-vacuum risk is also elevated (100).
Most distinctive characteristic
Most distinctive feature: exceptionally high connectivity (67, top quartile).
Jacobs reading
Old Fort York sits between an urban social park and an ecological retreat: moderately useful for both, exceptionally suited to neither.
Tradeoffs
- Connectivity (67) significantly outpaces natural comfort (40): well placed in the city but offers little shade or ecological respite.
- 25 nearby towers cast wind and shadow without contributing canopy: passive surveillance is plentiful but human-scale comfort is not.
- High connectivity coexists with high border-vacuum risk (100): much of that connectivity is to highways, rail, or parking lots, not to neighbourhoods.
Performance in context
- Reads as a modest underperformer relative to comparable parks (gap -10; cohort: large Corridor / Linear Park).
Typology classification
Classified as Corridor / Linear Park: shape elongation 2.4× a circle of equal area. Secondary read: Neighbourhood Park (6.3 ha, framed by 26 mid-rise vs 25 towers).
Edge Activation
Within 100 m of the park edge: 15 active uses (retail, transit_stop, cafe) and 42 dead/hostile uses (rail, parking_lot, highway). Active edges keep "eyes on the park" through the day; parking lots, blank institutional walls, rail and highway frontages drain street life.
Source: OSM POIs (amenity/shop) + Toronto Building Footprints + land use
Connectivity
Connectivity blends paths, intersections, transit, entrances, and edge density. This park has 35 mapped paths/walkways and 17 sidewalk segments within 50 m; 17 street intersections within 100 m; 28 transit stops within a 400 m walk; 7 estimated access points across ~2,117 m of perimeter. low edge density, significant superblock penalty applied. Source coverage: centreline, pedestrian_network, transit_osm.
Source: Toronto Centreline V2 + Pedestrian Network + OSM transit stops
Amenity Diversity
No amenities recorded. Score is 0 until inventory is loaded.
Source: Toronto Parks & Recreation Facilities + OSM amenity tags
Natural Comfort
Natural-comfort components for this park: ~5.4% effective canopy (0.0% from contiguous tree polygons + scattered tree density); nearest waterbody ~586 m; 49 city-mapped trees inside the polygon (7.8/ha). Reading: exposed. Source coverage: waterbodies, street_trees. Impervious surface is approximated (Toronto's authoritative layer ships only as a raster GeoTIFF).
Source: Toronto Treed Area + Ravine + Waterbodies + Street Tree Inventory
Enclosure / Eyes on Park
71 buildings within 25 m of the park edge (26 mid-rise, 20 low-rise, 25 tower); avg edge height 30.3 m (~10 floors); 3.4 buildings per 100 m of 2,117 m perimeter (strong frontage density); edges lean tall but still framed; 25 towers ≥ 40 m within 25 m of the edge. "Eyes on the park" come strongest from the 26 mid-rise edge buildings.
Source: Toronto 3D Massing (building footprints + heights)
Border Vacuum Risk
Border-vacuum factors within 50 m of the park: Oakville Subdivision, Western Lead, Oakville Subdivision, Oakville Subdivision, rail, Oakville Subdivision, parking_lot, Gardiner Expressway, parking_lot, Oakville Subdivision, Oakville Subdivision, Oakville Subdivision, Union Station Rail Corridor, Union Station Rail Corridor, Union Station Rail Corridor, Union Station Rail Corridor, Union Station Rail Corridor, Union Station Rail Corridor, Union Station Rail Corridor, Union Station Rail Corridor, Union Station Rail Corridor, Union Station Rail Corridor, Union Station Rail Corridor, Union Station Rail Corridor, Union Station Rail Corridor, Metrolinx Oakville Subdivision, Union Station Rail Corridor. Jacobs warned that highways, rail, parking lots and blank institutional edges act as "vacuums" that suppress foot traffic and isolate the park from its neighbourhood.
Source: Toronto Street Centreline (highways) + rail layer + OSM landuse + building footprints
Equity Context
Equity Context requires inputs not yet loaded for this park (Toronto Neighbourhood Profiles). Score is held at a neutral 50 with low confidence. Read with caution.
Source: Toronto Neighbourhood Profiles
Amenities (0)
No amenities recorded for this park.
Nearby active-edge features (80)
- rail: Oakville Subdivision0 m
- rail: Oakville Subdivision5 m
- rail: Oakville Subdivision5 m
- highway: Gardiner Expressway14 m
- rail: Oakville Subdivision15 m
- rail: Oakville Subdivision17 m
- rail17 m
- rail: Oakville Subdivision19 m
- parking lot19 m
- rail: Oakville Subdivision26 m
- parking lot28 m
- rail: Union Station Rail Corridor29 m
- rail: Union Station Rail Corridor30 m
- rail: Union Station Rail Corridor33 m
- rail: Metrolinx Oakville Subdivision34 m
- rail: Union Station Rail Corridor34 m
- rail: Western Lead35 m
- transit stop: Bathurst St at Fort York Blvd38 m
- rail: Union Station Rail Corridor38 m
- rail: Union Station Rail Corridor41 m
- rail: Union Station Rail Corridor44 m
- rail: Union Station Rail Corridor46 m
- rail: Union Station Rail Corridor46 m
- rail: Union Station Rail Corridor47 m
- rail: Union Station Rail Corridor48 m
- rail: Union Station Rail Corridor48 m
- rail: Union Station Rail Corridor50 m
- rail: Union Station Rail Corridor50 m
- rail: Oakville Subdivision50 m
- rail: Union Station Rail Corridor51 m
- parking lot51 m
- rail: Union Station Rail Corridor52 m
- transit stop53 m
- rail: Union Station Rail Corridor67 m
- rail: Oakville Subdivision67 m
- retail68 m
- rail: Union Station Rail Corridor69 m
- rail73 m
- parking lot77 m
- transit stop: Bathurst St at Fort York Blvd82 m
- rail: Union Station Rail Corridor84 m
- rail: Oakville Subdivision84 m
- retail: Floral & Decor84 m
- retail: Am2Pm Express Market89 m
- rail: Union Station Rail Corridor92 m
- retail: Miss Jones Fort York Outpost92 m
- rail: Union Station Rail Corridor93 m
- cafe: Aroma Espresso Bar93 m
- retail: Thyme Studio93 m
- parking lot94 m
- retail: Makeway96 m
- retail: COFO Design96 m
- cafe: Bean + Pearl96 m
- retail: Two Cities97 m
- rail: Union Station Rail Corridor98 m
- retail: Courage Cookies99 m
- retail: Organic Nail Bar100 m
- retail: CLOC Contemporary Consignment102 m
- rail: Oakville Subdivision104 m
- cafe: Milky's Cloud Room106 m
- rail107 m
- rail: Oakville Subdivision109 m
- retail: Promise Supply110 m
- retail: The Breakfast Pantry110 m
- rail112 m
- rail: Union Station Rail Corridor113 m
- retail: Auntie's Supply113 m
- transit stop116 m
- parking lot118 m
- retail: Farm Boy125 m
- parking lot126 m
- highway: Gardiner Expressway127 m
- retail: Wine Rack129 m
- transit stop: Fleet Street134 m
- cafe: Starbucks135 m
- rail135 m
- parking lot137 m
- rail: Union Station Rail Corridor142 m
- transit stop: Fleet St at Fort York Blvd West Side146 m
- rail: Oakville Subdivision147 m
Park profile
Five-axis radar across the structural dimensions.
Citywide percentile ranks
Across all Toronto parks in the dataset.
- Overall vitality13th
- Edge activation16th
- Connectivity86th
- Amenity diversity24th
- Natural comfort37th
- Enclosure33th
Most similar parks
Closest in metric space across the five structural dimensions.
- West Highland Creek WatercourseWaterfront Park35
- True Davidson ParkParkette33
- Humber River WatercourseWaterfront Park35
- Wexford HydroNeighbourhood Park31
- Southern Linear ParkCorridor / Linear Park26
Most opposite parks
Furthest in metric space. Useful for recognising what kind of park this isn’t.
- Kew GardensNeighbourhood Park71
- Leslie Grove ParkParkette68
- Market Lane ParkUrban Plaza63
- Joseph Burr Tyrrell ParkUrban Plaza50
- Manor Community GreenUrban Plaza57
Human activity signals: not available
No activity signals have landed for this park yet. The model has scored its physical form but it can’t yet say how often it’s programmed, photographed, or walked through. See /data-ethics for what we will and will not collect.
Does this score feel accurate?
Your read of Old Fort Yorkmatters. We’re testing whether the model lines up with how people actually use the park. Submissions are stored locally; no account needed.
Tell us how this park feels
We measure structure (canopy, edges, connectivity). You measure feeling. Both matter, and disagreement is itself useful civic data.
What would improve this park?
Generated from the weakest measured dimensions: a starting point, not a prescription.
- Activate the edges: encourage cafés, retail or community uses on the streets that face the park; replace blank or parking-lot edges where possible.
- Diversify what people can do in the park (playground, washroom, water, shade, performance, sport, garden): even small additions raise this score.
- Increase canopy and reduce paved area. Shade and water features extend usable hours and seasons.
- Mitigate border vacuums (highways, rail, parking) with active programming on the still-permeable edges and treat the hostile edge as a design challenge.
Data sources
- City of Toronto Open Data: Parks (Green Space)Polygon boundaries, official names, types.
- Parks & Recreation FacilitiesInventory of in-park amenities (washrooms, fields, rinks…).
- Toronto Pedestrian NetworkSidewalk segments around and through parks; estimated park entrances.
- Toronto Centreline V2Street segments + intersection nodes near park edges; trails and walkways.
- Toronto 3D MassingBuilding footprints + heights for edge-building counts, frontage density, and tower-in-the-park risk.
- Toronto Treed AreaTree canopy share inside park polygons via stratified-grid sampling.
- Toronto Waterbodies & RiversWater surface inside parks + nearest-water distance for cooling.
- Ravine & Natural Feature ProtectionRavine overlap as a cooling / natural-comfort signal.
- Toronto Street Tree InventoryTree count + density inside park polygons.
- Neighbourhood Profiles(Pending) Equity context proxy.
- OpenStreetMap (Overpass API)Cafés, restaurants, retail, transit stops, parking, highways, rail.