Masaryk Park
Urban Plaza, one of the city's strongest overall (score 56, rank ~99th percentile). Strongest: enclosure; weakest: natural comfort.
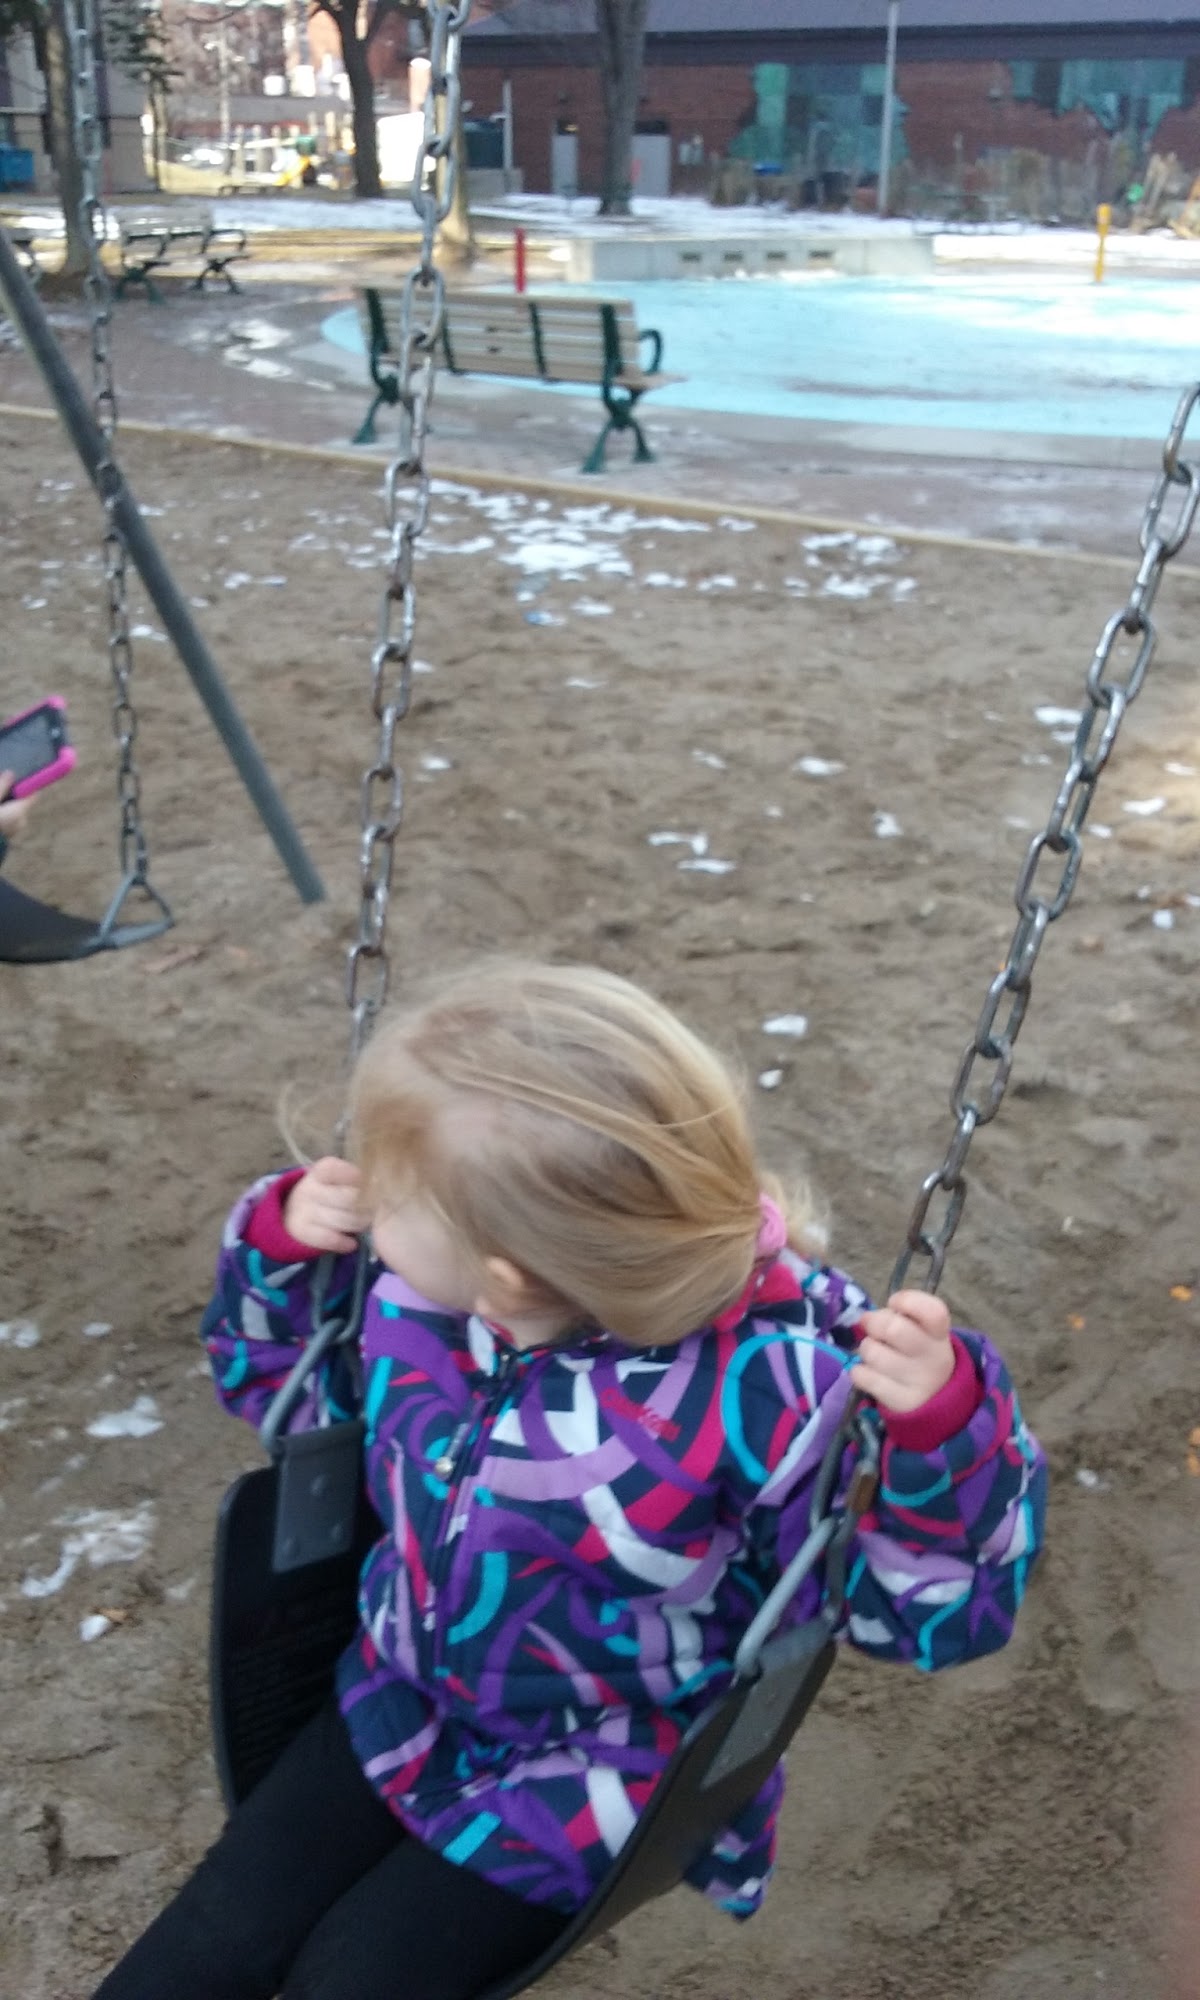
Photo by Gord Graham via Google Places · cached 5/9/2026
Masaryk Park scores 56.4 / 100. Strongest dimensions: enclosure / eyes on park and connectivity. Weakest: amenity diversity (28.4). Border-vacuum risk is low. This score is a transparent reading of Jane Jacobs-style vitality factors, not a definitive judgment.
Area · 0.58 ha
Weighted across six dimensions · confidence 68%
Scores are not bell-curved. Percentiles and expected scores provide context without changing the underlying model.
Loading map…
The parks map is loading.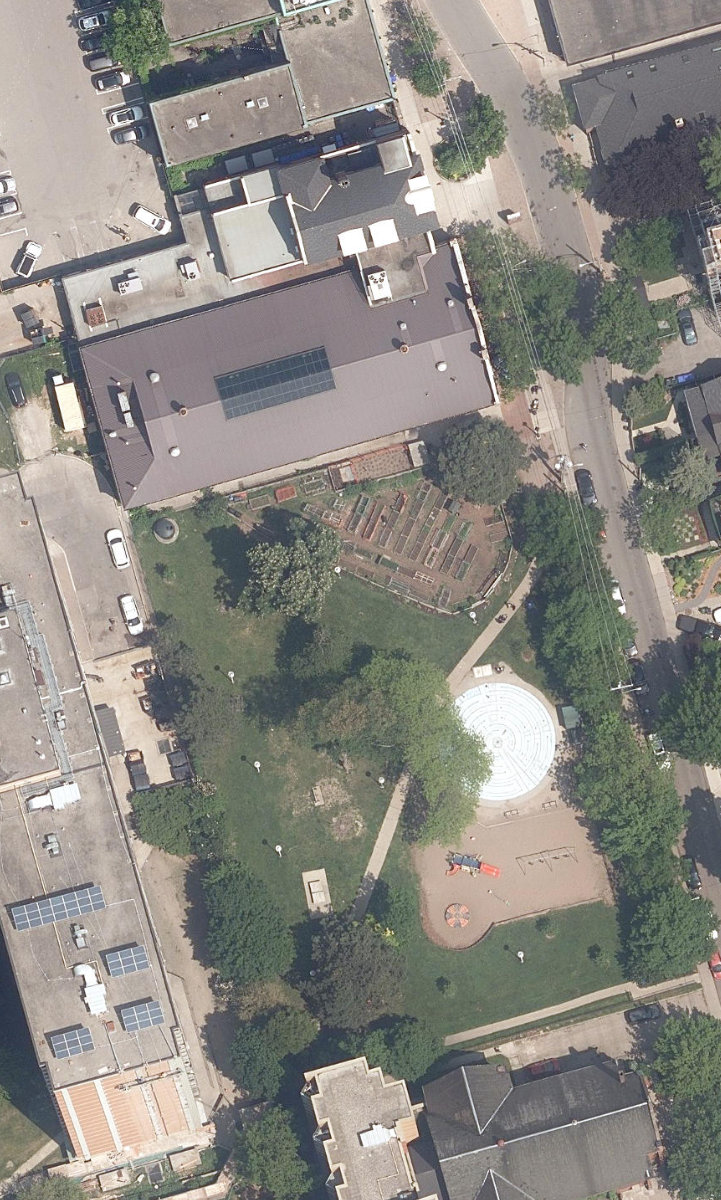
Explain this score
Where did the 56 come from? Each weighted contribution against a neutral 50 baseline. Green = pushed up; red = pulled down.
Sum of contributions = the headline score. A negative bar means that dimension dragged the park below the city-wide neutral baseline.
Why this park works
Masaryk Park works because its enclosure score (94) is one of the city's strongest and its edge activation (53) is also top decile (31 mid-rise buildings frame the edge with passive surveillance).
What limits this park
.
Most distinctive characteristic
Most distinctive feature: exceptionally high enclosure (94, top decile).
Jacobs reading
Masaryk Park sits between an urban social park and an ecological retreat: moderately useful for both, exceptionally suited to neither.
Performance in context
- This park is a strong overperformer for its cohort: raw 56 versus an expected 39 for similar parks (small Urban Plaza) (gap +18).
Typology classification
Classified as Urban Plaza: 5847 m², paved (0% canopy), 24.4 buildings/100 m
Edge Activation
Within 100 m of the park edge: 35 active uses (retail, community, restaurant, cafe, transit_stop) and 4 dead/hostile uses (parking_lot). Active edges keep "eyes on the park" through the day; parking lots, blank institutional walls, rail and highway frontages drain street life.
Source: OSM POIs (amenity/shop) + Toronto Building Footprints + land use
Connectivity
Connectivity blends paths, intersections, transit, entrances, and edge density. This park has 2 mapped paths/walkways and 12 sidewalk segments within 50 m; 11 street intersections within 100 m; 24 transit stops within a 400 m walk; 4 estimated access points across ~340 m of perimeter. edge density is healthy, no superblock penalty. Source coverage: centreline, pedestrian_network, transit_osm.
Source: Toronto Centreline V2 + Pedestrian Network + OSM transit stops
Amenity Diversity
3 distinct amenity types in the park (community_centre, playground, tennis). Diversity, not raw count, drives the score so a park with many distinct activity types can outrank a larger park that repeats the same use.
Source: Toronto Parks & Recreation Facilities + OSM amenity tags
Natural Comfort
Natural-comfort components for this park: ~14.0% effective canopy (0.0% from contiguous tree polygons + scattered tree density); nearest waterbody ~866 m; 20 city-mapped trees inside the polygon (20.0/ha). Reading: exposed. Source coverage: waterbodies, street_trees. Impervious surface is approximated (Toronto's authoritative layer ships only as a raster GeoTIFF).
Source: Toronto Treed Area + Ravine + Waterbodies + Street Tree Inventory
Enclosure / Eyes on Park
83 buildings within 25 m of the park edge (31 mid-rise, 51 low-rise, 1 tower); avg edge height 9.2 m (~3 floors); 24.4 buildings per 100 m of 340 m perimeter (strong frontage density); edges are at a Jacobs-scale walkable mid-rise (3 to 7 floors); 1 tower ≥ 40 m within 25 m of the edge. "Eyes on the park" come strongest from the 31 mid-rise edge buildings.
Source: Toronto 3D Massing (building footprints + heights)
Border Vacuum Risk
Border-vacuum factors within 50 m of the park: parking_lot, parking_lot. Jacobs warned that highways, rail, parking lots and blank institutional edges act as "vacuums" that suppress foot traffic and isolate the park from its neighbourhood.
Source: Toronto Street Centreline (highways) + rail layer + OSM landuse + building footprints
Equity Context
Equity Context requires inputs not yet loaded for this park (Toronto Neighbourhood Profiles). Score is held at a neutral 50 with low confidence. Read with caution.
Source: Toronto Neighbourhood Profiles
Amenities (3 types · 3 records)
- community centre
- playground
- tennis
Nearby active-edge features (80)
- community: Masaryk-Cowan Community Centre0 m
- parking lot18 m
- retail: The Workroom27 m
- parking lot40 m
- retail: Yioi Beauty Spa47 m
- restaurant: Simpl Things54 m
- transit stop: O'Hara Avenue55 m
- restaurant: Daymi59 m
- retail: JR's Natural Health & Bulk59 m
- restaurant: T.O. Lounge59 m
- retail: Queen Fresh Market59 m
- retail: Loohoo59 m
- retail60 m
- retail: Queen Nails & Spa60 m
- retail: Home Hardware61 m
- cafe: Larry's Place61 m
- restaurant: Daol Korean Restaurant62 m
- retail: Sunny Day Atelier62 m
- retail: Expedia Cruises62 m
- cafe: Boba Tea63 m
- retail: Annam Studio64 m
- retail: 4 Your Hair Extensions65 m
- retail: My Legacy Cannabis Dispensary67 m
- parking lot67 m
- retail: Super Land Market70 m
- retail71 m
- transit stop: Brock Avenue74 m
- retail: Klute Hair78 m
- cafe: Capital Espresso83 m
- retail84 m
- restaurant: Shambhala Kitchen86 m
- retail: Tara Thrift91 m
- retail: Mississaugas of the Credit Medicine Wheel91 m
- transit stop: Dunn Avenue91 m
- transit stop: Dunn Avenue94 m
- retail: Best Convenience95 m
- parking lot97 m
- restaurant: Hanoi Restaurant99 m
- retail: Metro Cycle99 m
- retail: Fire & Flower101 m
- retail: Common Sort104 m
- retail: Budget One Stop105 m
- transit stop: Brock Avenue105 m
- cafe: Sam James Coffee Bar106 m
- restaurant: The Momo House108 m
- retail: Robinson Bread108 m
- retail: Park Agency Print Shop113 m
- parking lot116 m
- parking lot118 m
- retail120 m
- parking lot121 m
- restaurant: Mother India121 m
- community: Creating Together EarlyON Child and Family Centre122 m
- parking lot123 m
- retail: Matchbox Tattoo126 m
- retail: TO Beauty Bar126 m
- retail: Paper Plus Cloth128 m
- restaurant: Skyline Restaurant130 m
- parking lot133 m
- restaurant: BB's133 m
- retail: Made You Look Jewellery135 m
- restaurant: Al Jood137 m
- retail: Lola139 m
- restaurant: Pizza Pizza140 m
- retail: Gas City143 m
- restaurant: Craig's Cookies148 m
- restaurant: Kaminari152 m
- retail: Dang Jewellery & Watches157 m
- retail: Lumicrest Professional LED Lighting158 m
- retail: Lynn's Convenience160 m
- cafe: Chloe Cafe161 m
- retail: The Local Market165 m
- parking lot166 m
- restaurant: Nuna167 m
- restaurant: Molkagtez Mexican Cuisine173 m
- parking lot173 m
- restaurant: Mary Brown's177 m
- retail: Lucky Vapes177 m
- retail: Smoke N Fire181 m
- retail: Lucky Supermarket183 m
Park profile
Five-axis radar across the structural dimensions.
Citywide percentile ranks
Across all Toronto parks in the dataset.
- Overall vitality99th
- Edge activation97th
- Connectivity85th
- Amenity diversity94th
- Natural comfort55th
- Enclosure98th
Most similar parks
Closest in metric space across the five structural dimensions.
- Stanley Park South - TorontoAthletic / Recreation Park60
- Grange ParkNeighbourhood Park60
- Malta ParkUrban Plaza58
- Wells Hill ParkParkette61
- Snider ParketteUrban Plaza44
Most opposite parks
Furthest in metric space. Useful for recognising what kind of park this isn’t.
- Toronto Islands - Muggs Island ParkRavine / Naturalized Park25
- Trca Lands ( 26)Ravine / Naturalized Park27
- Rouge ParkWaterfront Park25
- Rouge ParkRavine / Naturalized Park21
- Rouge ParkRavine / Naturalized Park28
Visitor signals
Public attention measured by Google Places aggregates. This proxies attention, not occupancy. Aggregate-only: no usernames, no review text, no extra photos beyond the cached hero.
p36 citywide · p25 within Urban Plaza
Source: Google Places API · match unverified (0.00 composite confidence) · last refreshed 5/9/2026. Privacy contract. Measures public attention, not occupancy.
Human activity signals: not available
No activity signals have landed for this park yet. The model has scored its physical form but it can’t yet say how often it’s programmed, photographed, or walked through. See /data-ethics for what we will and will not collect.
Does this score feel accurate?
Your read of Masaryk Parkmatters. We’re testing whether the model lines up with how people actually use the park. Submissions are stored locally; no account needed.
Tell us how this park feels
We measure structure (canopy, edges, connectivity). You measure feeling. Both matter, and disagreement is itself useful civic data.
What would improve this park?
Generated from the weakest measured dimensions: a starting point, not a prescription.
- Diversify what people can do in the park (playground, washroom, water, shade, performance, sport, garden): even small additions raise this score.
- Increase canopy and reduce paved area. Shade and water features extend usable hours and seasons.
Data sources
- City of Toronto Open Data: Parks (Green Space)Polygon boundaries, official names, types.
- Parks & Recreation FacilitiesInventory of in-park amenities (washrooms, fields, rinks…).
- Toronto Pedestrian NetworkSidewalk segments around and through parks; estimated park entrances.
- Toronto Centreline V2Street segments + intersection nodes near park edges; trails and walkways.
- Toronto 3D MassingBuilding footprints + heights for edge-building counts, frontage density, and tower-in-the-park risk.
- Toronto Treed AreaTree canopy share inside park polygons via stratified-grid sampling.
- Toronto Waterbodies & RiversWater surface inside parks + nearest-water distance for cooling.
- Ravine & Natural Feature ProtectionRavine overlap as a cooling / natural-comfort signal.
- Toronto Street Tree InventoryTree count + density inside park polygons.
- Neighbourhood Profiles(Pending) Equity context proxy.
- OpenStreetMap (Overpass API)Cafés, restaurants, retail, transit stops, parking, highways, rail.