Wells Hill Park
Parkette, one of the city's strongest overall (score 61, rank ~100th percentile). Strongest: connectivity; weakest: natural comfort.
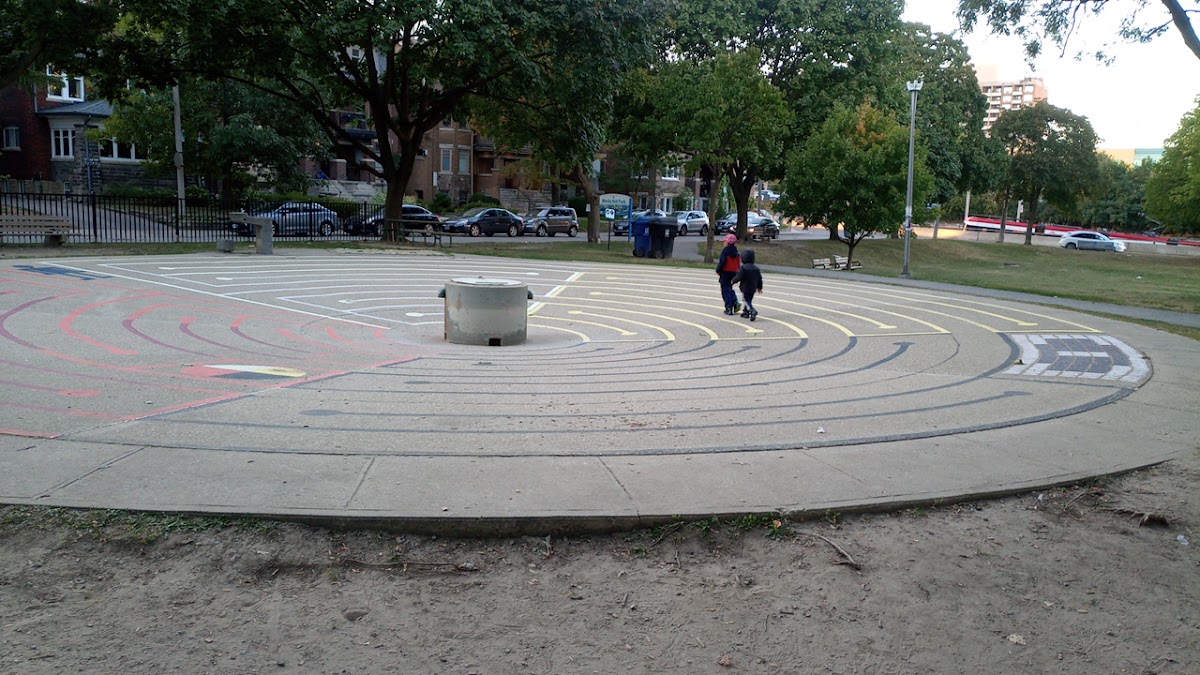
Photo by martinaz Joice via Google Places · cached 5/9/2026
Wells Hill Park scores 61 / 100. Strongest dimensions: enclosure / eyes on park and connectivity. Weakest: amenity diversity (34.5). Border-vacuum risk is low. This score is a transparent reading of Jane Jacobs-style vitality factors, not a definitive judgment.
Area · 0.76 ha
Weighted across six dimensions · confidence 68%
Scores are not bell-curved. Percentiles and expected scores provide context without changing the underlying model.
Loading map…
The parks map is loading.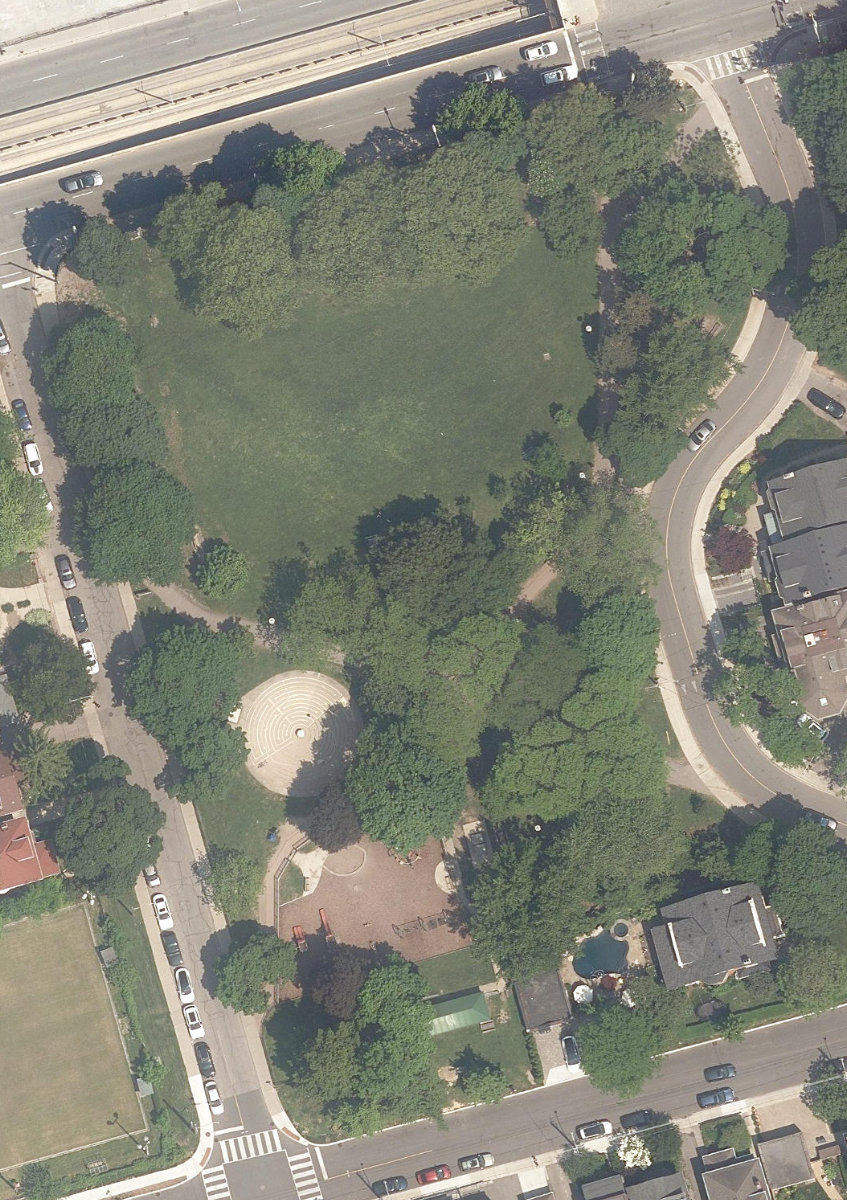
Explain this score
Where did the 61 come from? Each weighted contribution against a neutral 50 baseline. Green = pushed up; red = pulled down.
Sum of contributions = the headline score. A negative bar means that dimension dragged the park below the city-wide neutral baseline.
Why this park works
Wells Hill Park works because its connectivity score (79) is one of the city's strongest and its enclosure (91) is also top decile (37 transit stops sit within a 400 m walk; 12 intersections fall within 100 m of the edge).
What limits this park
Wells Hill Park doesn't have a clear weakness. Every measured dimension is at or above the middle of the pack.
Most distinctive characteristic
Most distinctive feature: exceptionally high connectivity (79, top decile).
Jacobs reading
Wells Hill Park sits between an urban social park and an ecological retreat: moderately useful for both, exceptionally suited to neither.
Tradeoffs
- Connectivity (79) significantly outpaces natural comfort (41): well placed in the city but offers little shade or ecological respite.
Performance in context
- This park is a strong overperformer for its cohort: raw 61 versus an expected 36 for similar parks (small Parkette) (gap +25).
Typology classification
Classified as Parkette: small (7575 m²) with strong building frontage (18.4 per 100 m)
Edge Activation
Within 100 m of the park edge: 9 active uses (retail, transit_stop, restaurant) and 1 dead/hostile uses (parking_lot). Active edges keep "eyes on the park" through the day; parking lots, blank institutional walls, rail and highway frontages drain street life.
Source: OSM POIs (amenity/shop) + Toronto Building Footprints + land use
Connectivity
Connectivity blends paths, intersections, transit, entrances, and edge density. This park has 13 mapped paths/walkways and 29 sidewalk segments within 50 m; 12 street intersections within 100 m; 37 transit stops within a 400 m walk; 11 estimated access points across ~402 m of perimeter. edge density is healthy, no superblock penalty. Source coverage: centreline, pedestrian_network, transit_osm.
Source: Toronto Centreline V2 + Pedestrian Network + OSM transit stops
Amenity Diversity
4 distinct amenity types in the park (picnic, playground, tennis, washroom). Diversity, not raw count, drives the score so a park with many distinct activity types can outrank a larger park that repeats the same use.
Source: Toronto Parks & Recreation Facilities + OSM amenity tags
Natural Comfort
Natural-comfort components for this park: ~6.3% effective canopy (0.0% from contiguous tree polygons + scattered tree density); nearest waterbody ~553 m; 9 city-mapped trees inside the polygon (9.0/ha). Reading: exposed. Source coverage: waterbodies, street_trees. Impervious surface is approximated (Toronto's authoritative layer ships only as a raster GeoTIFF).
Source: Toronto Treed Area + Ravine + Waterbodies + Street Tree Inventory
Enclosure / Eyes on Park
74 buildings within 25 m of the park edge (23 mid-rise, 47 low-rise, 4 tower); avg edge height 12.5 m (~4 floors); 18.4 buildings per 100 m of 402 m perimeter (strong frontage density); edges are at a Jacobs-scale walkable mid-rise (3 to 7 floors); 4 towers ≥ 40 m within 25 m of the edge. "Eyes on the park" come strongest from the 23 mid-rise edge buildings.
Source: Toronto 3D Massing (building footprints + heights)
Border Vacuum Risk
Park edges face the city. No significant border vacuum detected.
Source: Toronto Street Centreline (highways) + rail layer + OSM landuse + building footprints
Equity Context
Equity Context requires inputs not yet loaded for this park (Toronto Neighbourhood Profiles). Score is held at a neutral 50 with low confidence. Read with caution.
Source: Toronto Neighbourhood Profiles
Amenities (4 types · 4 records)
- picnic
- playground
- tennis
- washroom
Nearby active-edge features (50)
- retail: Joe Fresh38 m
- retail: Loblaws50 m
- transit stop: Bathurst57 m
- transit stop: Bathurst58 m
- transit stop: St. Clair Av West, South Entrance62 m
- parking lot66 m
- restaurant: A&W74 m
- transit stop: St. Clair Av West, North Entrance78 m
- restaurant: Popeyes83 m
- retail: LCBO85 m
- retail: Annex RMT105 m
- transit stop: St. Clair West Station107 m
- transit stop: St. Clair West Station114 m
- parking lot119 m
- transit stop: Bathurst St at St Clair Ave West119 m
- transit stop: Bathurst St at St Clair Ave West120 m
- restaurant: Urban Fare Catering & Food Shop120 m
- retail: INS Market120 m
- retail: Freedom Mobile121 m
- transit stop: St. Clair West Station122 m
- retail: Blue Paisley Fine Rugs124 m
- retail: Dollarama126 m
- cafe: Bakery Garden Café127 m
- restaurant: Osmow's128 m
- parking lot130 m
- retail: Fantasy Dry Cleaning & Alteration132 m
- restaurant: Pizza Del Arte132 m
- parking lot135 m
- restaurant: Harvey's137 m
- transit stop: St. Clair West Station138 m
- retail: Clairhurst Eye Care142 m
- transit stop: St. Clair West Station150 m
- retail: Evergreen Natural Foods150 m
- transit stop: Bathurst152 m
- transit stop: Bathurst152 m
- transit stop: Helena Avenue154 m
- restaurant: Booyah158 m
- restaurant: Wychwood Pub162 m
- retail: Neighbors Market163 m
- retail: Pet Mama172 m
- retail: Source Organics182 m
- transit stop: St. Clair West183 m
- retail: Wine Rack183 m
- transit stop: St. Clair West185 m
- retail: Prayasha187 m
- transit stop: Tweedsmuir196 m
- transit stop: Tweedsmuir Avenue196 m
- transit stop: Vaughan198 m
- transit stop: Vaughan198 m
- restaurant: Kiyo Japanese Cuisine198 m
Park profile
Five-axis radar across the structural dimensions.
Citywide percentile ranks
Across all Toronto parks in the dataset.
- Overall vitality100th
- Edge activation96th
- Connectivity98th
- Amenity diversity96th
- Natural comfort40th
- Enclosure97th
Most similar parks
Closest in metric space across the five structural dimensions.
- Grange ParkNeighbourhood Park60
- East Toronto Athletic FieldNeighbourhood Park50
- Alexandra ParkNeighbourhood Park55
- Stanley Park South - TorontoAthletic / Recreation Park60
- Trace Manes ParkAthletic / Recreation Park55
Most opposite parks
Furthest in metric space. Useful for recognising what kind of park this isn’t.
- Toronto Islands - Muggs Island ParkRavine / Naturalized Park25
- Trca Lands ( 26)Ravine / Naturalized Park27
- Rouge ParkWaterfront Park25
- Rouge ParkRavine / Naturalized Park28
- Rouge ParkRavine / Naturalized Park26
Visitor signals
Public attention measured by Google Places aggregates. This proxies attention, not occupancy. Aggregate-only: no usernames, no review text, no extra photos beyond the cached hero.
“Trees stud this low-key park offering picnic tables & a children's playground & wading pool.” (Google editorial summary)
p83 citywide · p88 within Parkette
Source: Google Places API · match unverified (0.00 composite confidence) · last refreshed 5/9/2026. Privacy contract. Measures public attention, not occupancy.
Human activity signals: not available
No activity signals have landed for this park yet. The model has scored its physical form but it can’t yet say how often it’s programmed, photographed, or walked through. See /data-ethics for what we will and will not collect.
Does this score feel accurate?
Your read of Wells Hill Parkmatters. We’re testing whether the model lines up with how people actually use the park. Submissions are stored locally; no account needed.
Tell us how this park feels
We measure structure (canopy, edges, connectivity). You measure feeling. Both matter, and disagreement is itself useful civic data.
What would improve this park?
Generated from the weakest measured dimensions: a starting point, not a prescription.
- Diversify what people can do in the park (playground, washroom, water, shade, performance, sport, garden): even small additions raise this score.
- Increase canopy and reduce paved area. Shade and water features extend usable hours and seasons.
Data sources
- City of Toronto Open Data: Parks (Green Space)Polygon boundaries, official names, types.
- Parks & Recreation FacilitiesInventory of in-park amenities (washrooms, fields, rinks…).
- Toronto Pedestrian NetworkSidewalk segments around and through parks; estimated park entrances.
- Toronto Centreline V2Street segments + intersection nodes near park edges; trails and walkways.
- Toronto 3D MassingBuilding footprints + heights for edge-building counts, frontage density, and tower-in-the-park risk.
- Toronto Treed AreaTree canopy share inside park polygons via stratified-grid sampling.
- Toronto Waterbodies & RiversWater surface inside parks + nearest-water distance for cooling.
- Ravine & Natural Feature ProtectionRavine overlap as a cooling / natural-comfort signal.
- Toronto Street Tree InventoryTree count + density inside park polygons.
- Neighbourhood Profiles(Pending) Equity context proxy.
- OpenStreetMap (Overpass API)Cafés, restaurants, retail, transit stops, parking, highways, rail.