Snider Parkette
Urban Plaza, in the top tier overall (score 44, rank ~88th percentile). Strongest: enclosure; weakest: natural comfort.
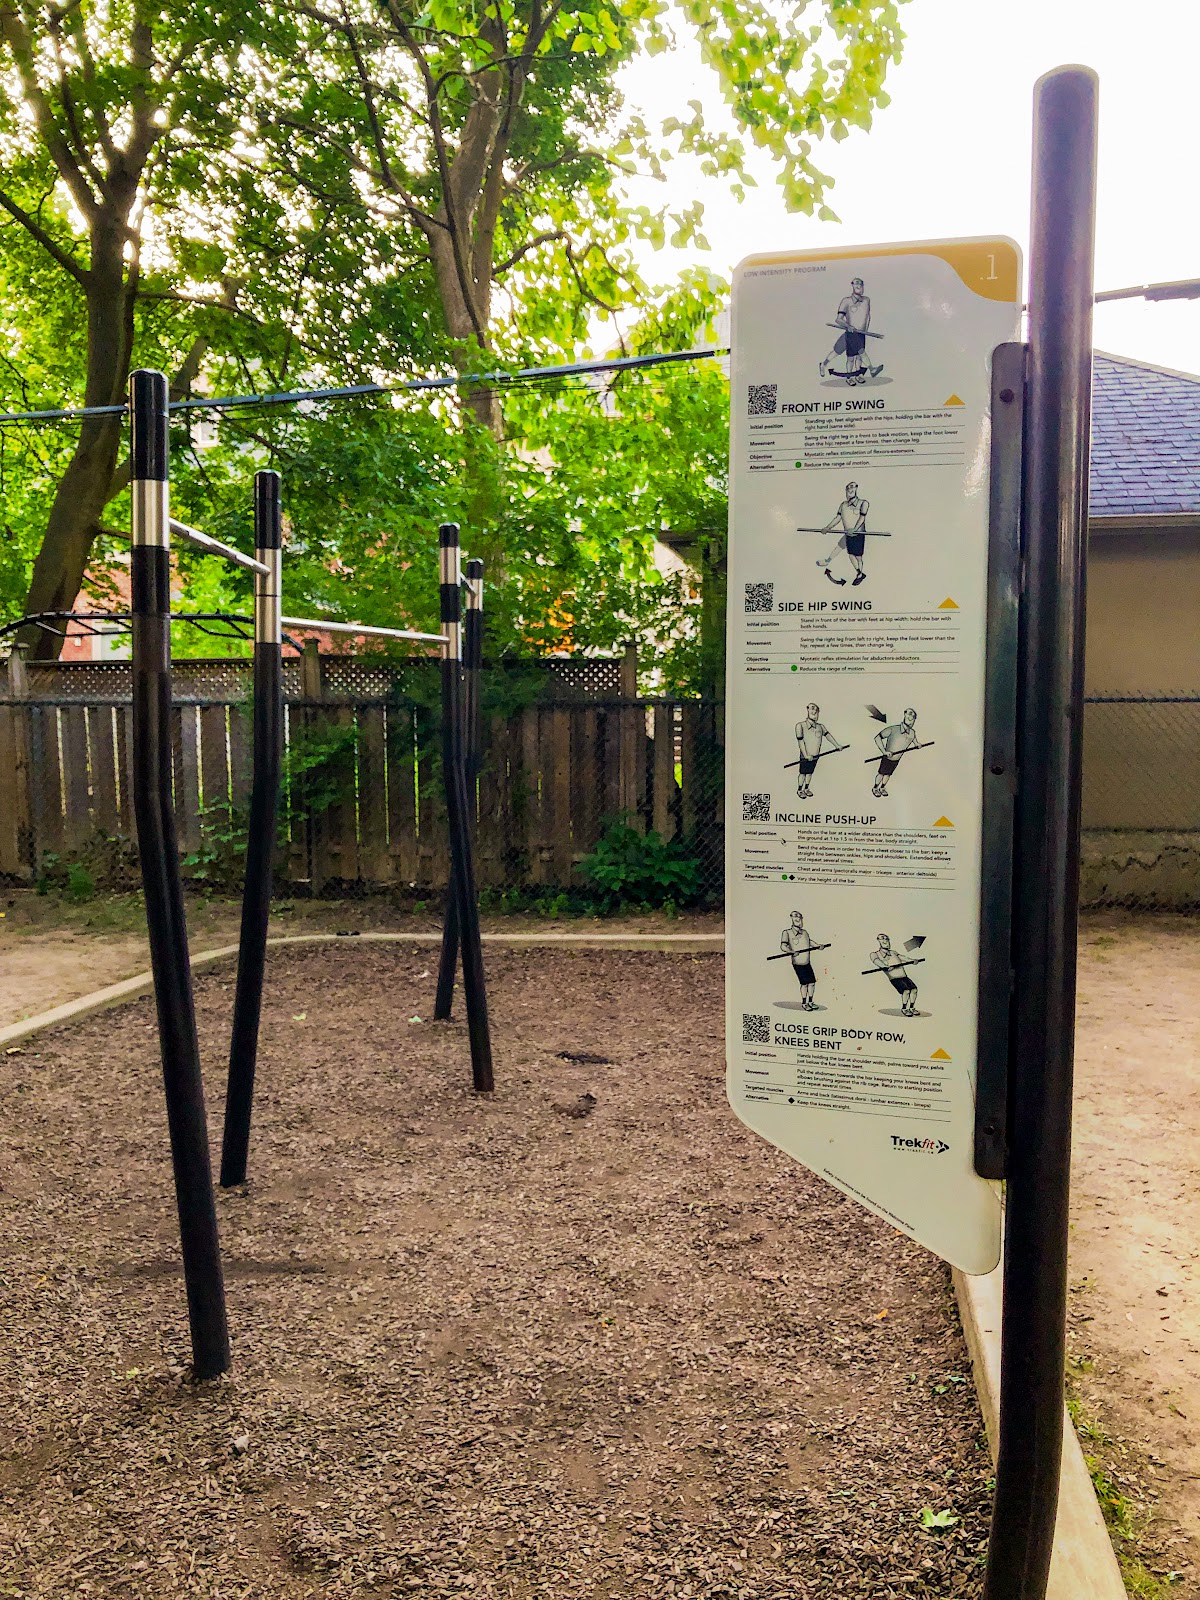
Photo by Reynold Chua via Google Places · cached 5/9/2026
Snider Parkette scores 44.3 / 100. Strongest dimensions: enclosure / eyes on park and connectivity. Weakest: amenity diversity (27.3). Border-vacuum risk is elevated (100). This score is a transparent reading of Jane Jacobs-style vitality factors, not a definitive judgment.
Area · 0.18 ha
Weighted across six dimensions · confidence 70%
Scores are not bell-curved. Percentiles and expected scores provide context without changing the underlying model.
Loading map…
The parks map is loading.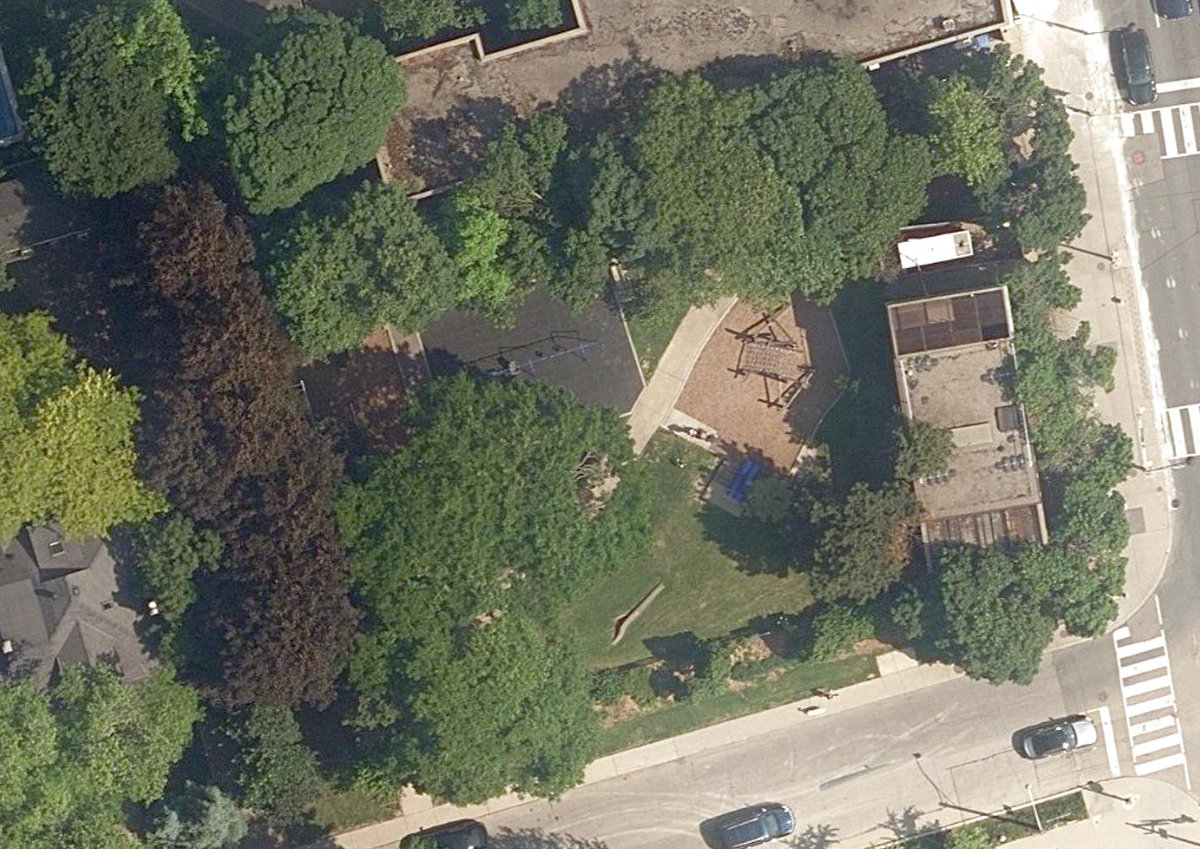
Explain this score
Where did the 44 come from? Each weighted contribution against a neutral 50 baseline. Green = pushed up; red = pulled down.
Sum of contributions = the headline score. A negative bar means that dimension dragged the park below the city-wide neutral baseline.
Why this park works
Snider Parkette works because its enclosure score (93) is one of the city's strongest and its amenity diversity (27) is also top decile (10 mid-rise buildings frame the edge with passive surveillance).
What limits this park
Snider Parkette's edges are fronted by border-vacuum land uses (highways, rail, parking, blank institutional), risk score 100.
Most distinctive characteristic
Most distinctive feature: exceptionally high enclosure (93, top decile).
Jacobs reading
Snider Parkette sits between an urban social park and an ecological retreat: moderately useful for both, exceptionally suited to neither.
Performance in context
- A modest overperformer for its urban plaza typology (+8 vs the median in pocket Urban Plaza).
Typology classification
Classified as Urban Plaza: 1774 m², paved (11% canopy), 27.6 buildings/100 m
Edge Activation
Within 100 m of the park edge: 24 active uses (transit_stop, restaurant, cafe, retail, school) and 5 dead/hostile uses (highway, parking_lot). Active edges keep "eyes on the park" through the day; parking lots, blank institutional walls, rail and highway frontages drain street life.
Source: OSM POIs (amenity/shop) + Toronto Building Footprints + land use
Connectivity
Connectivity blends paths, intersections, transit, entrances, and edge density. This park has 4 mapped paths/walkways and 14 sidewalk segments within 50 m; 5 street intersections within 100 m; 7 transit stops within a 400 m walk; 2 estimated access points across ~192 m of perimeter. edge density is healthy, no superblock penalty. Source coverage: centreline, pedestrian_network, transit_osm.
Source: Toronto Centreline V2 + Pedestrian Network + OSM transit stops
Amenity Diversity
3 distinct amenity types in the park (fitness, playground, tennis). Diversity, not raw count, drives the score so a park with many distinct activity types can outrank a larger park that repeats the same use.
Source: Toronto Parks & Recreation Facilities + OSM amenity tags
Natural Comfort
Natural-comfort components for this park: 11.1% estimated tree canopy; nearest waterbody ~413 m. Reading: exposed. Source coverage: treed_area, waterbodies. Impervious surface is approximated (Toronto's authoritative layer ships only as a raster GeoTIFF).
Source: Toronto Treed Area + Ravine + Waterbodies + Street Tree Inventory
Enclosure / Eyes on Park
53 buildings within 25 m of the park edge (10 mid-rise, 43 low-rise, 0 tower); avg edge height 9.0 m (~3 floors); 27.6 buildings per 100 m of 192 m perimeter (strong frontage density); edges are at a Jacobs-scale walkable mid-rise (3 to 7 floors); no towers immediately adjacent. "Eyes on the park" come strongest from the 10 mid-rise edge buildings.
Source: Toronto 3D Massing (building footprints + heights)
Border Vacuum Risk
Border-vacuum factors within 50 m of the park: Yonge Street, parking_lot, Yonge Street, Yonge Street. Jacobs warned that highways, rail, parking lots and blank institutional edges act as "vacuums" that suppress foot traffic and isolate the park from its neighbourhood.
Source: Toronto Street Centreline (highways) + rail layer + OSM landuse + building footprints
Equity Context
Equity Context requires inputs not yet loaded for this park (Toronto Neighbourhood Profiles). Score is held at a neutral 50 with low confidence. Read with caution.
Source: Toronto Neighbourhood Profiles
Amenities (3 types · 3 records)
- fitness
- playground
- tennis
Nearby active-edge features (55)
- transit stop: Yonge St at Lytton Blvd7 m
- cafe: Sava Crepes & Coffee11 m
- highway: Yonge Street14 m
- highway: Yonge Street17 m
- restaurant: Mandy's21 m
- retail: Tabac Cuban Cigars24 m
- transit stop: Yonge St at Blythwood Rd35 m
- parking lot36 m
- highway: Yonge Street37 m
- restaurant: Domino's47 m
- restaurant: C'est Bon47 m
- school: Blyth Academy Lawrence Park48 m
- cafe: Denovia Cafe50 m
- retail: Fuzz Wax Bar55 m
- retail: All That Sparkles61 m
- retail: Australian Boot Company64 m
- retail: La Rocca Creative Kitchen74 m
- parking lot77 m
- restaurant: The Captain’s Boil82 m
- restaurant: Himalayan Momo House84 m
- retail: Testa Uomo85 m
- retail: Canopy Blue85 m
- restaurant: City Kebab89 m
- retail: Nailsense92 m
- retail: The Ritz Unisex Salon92 m
- retail: Thean Nail Lounge95 m
- retail: My Inner Child Paint Bar Studio99 m
- retail: Prayosha Threading & Wax Bar99 m
- retail: Ikon Salon99 m
- cafe: Starbucks100 m
- retail: Favorite Nails & Spa104 m
- retail: Alexandra Cleaners107 m
- retail: Blo117 m
- retail: Dog Daycare & Grooming Boutique118 m
- retail122 m
- retail: Fresh Fruits House124 m
- retail: Bailey Nelson130 m
- restaurant: Cosmic Pizza & Donair132 m
- restaurant: Revitasize136 m
- restaurant: Bestung M136 m
- highway: Yonge Street138 m
- restaurant: Roberto’s Ristorante141 m
- retail: Civello145 m
- retail: Running Room149 m
- highway: Yonge Street150 m
- retail: Blu Boho151 m
- parking lot151 m
- restaurant: A&W155 m
- retail: Andrea’s Cookies157 m
- transit stop: Glencairn Avenue166 m
- retail: Primenko Home Appliances & Electronics178 m
- cafe: Tim Hortons185 m
- retail: See & Be Seen Eyecare193 m
- parking lot194 m
- retail: PP Beauty & Academy195 m
Park profile
Five-axis radar across the structural dimensions.
Citywide percentile ranks
Across all Toronto parks in the dataset.
- Overall vitality88th
- Edge activation92th
- Connectivity72th
- Amenity diversity92th
- Natural comfort63th
- Enclosure98th
Most similar parks
Closest in metric space across the five structural dimensions.
- Stanley Park North - TorontoAthletic / Recreation Park53
- Masaryk ParkUrban Plaza56
- Joseph Workman ParkUrban Plaza50
- Lakeshore Village ParkNeighbourhood Park51
- Jonathan Ashbridge ParkNeighbourhood Park54
Most opposite parks
Furthest in metric space. Useful for recognising what kind of park this isn’t.
- Toronto Islands - Muggs Island ParkRavine / Naturalized Park25
- Rouge ParkWaterfront Park25
- Trca Lands ( 26)Ravine / Naturalized Park27
- Rouge ParkRavine / Naturalized Park21
- Rouge ParkRavine / Naturalized Park28
Visitor signals
Public attention measured by Google Places aggregates. This proxies attention, not occupancy. Aggregate-only: no usernames, no review text, no extra photos beyond the cached hero.
p73 citywide · p78 within Urban Plaza
Source: Google Places API · match high (0.97 composite confidence) · last refreshed 5/9/2026. Privacy contract. Measures public attention, not occupancy.
Human activity signals: not available
No activity signals have landed for this park yet. The model has scored its physical form but it can’t yet say how often it’s programmed, photographed, or walked through. See /data-ethics for what we will and will not collect.
Does this score feel accurate?
Your read of Snider Parkettematters. We’re testing whether the model lines up with how people actually use the park. Submissions are stored locally; no account needed.
Tell us how this park feels
We measure structure (canopy, edges, connectivity). You measure feeling. Both matter, and disagreement is itself useful civic data.
What would improve this park?
Generated from the weakest measured dimensions: a starting point, not a prescription.
- Activate the edges: encourage cafés, retail or community uses on the streets that face the park; replace blank or parking-lot edges where possible.
- Diversify what people can do in the park (playground, washroom, water, shade, performance, sport, garden): even small additions raise this score.
- Mitigate border vacuums (highways, rail, parking) with active programming on the still-permeable edges and treat the hostile edge as a design challenge.
Data sources
- City of Toronto Open Data: Parks (Green Space)Polygon boundaries, official names, types.
- Parks & Recreation FacilitiesInventory of in-park amenities (washrooms, fields, rinks…).
- Toronto Pedestrian NetworkSidewalk segments around and through parks; estimated park entrances.
- Toronto Centreline V2Street segments + intersection nodes near park edges; trails and walkways.
- Toronto 3D MassingBuilding footprints + heights for edge-building counts, frontage density, and tower-in-the-park risk.
- Toronto Treed AreaTree canopy share inside park polygons via stratified-grid sampling.
- Toronto Waterbodies & RiversWater surface inside parks + nearest-water distance for cooling.
- Ravine & Natural Feature ProtectionRavine overlap as a cooling / natural-comfort signal.
- Toronto Street Tree InventoryTree count + density inside park polygons.
- Neighbourhood Profiles(Pending) Equity context proxy.
- OpenStreetMap (Overpass API)Cafés, restaurants, retail, transit stops, parking, highways, rail.