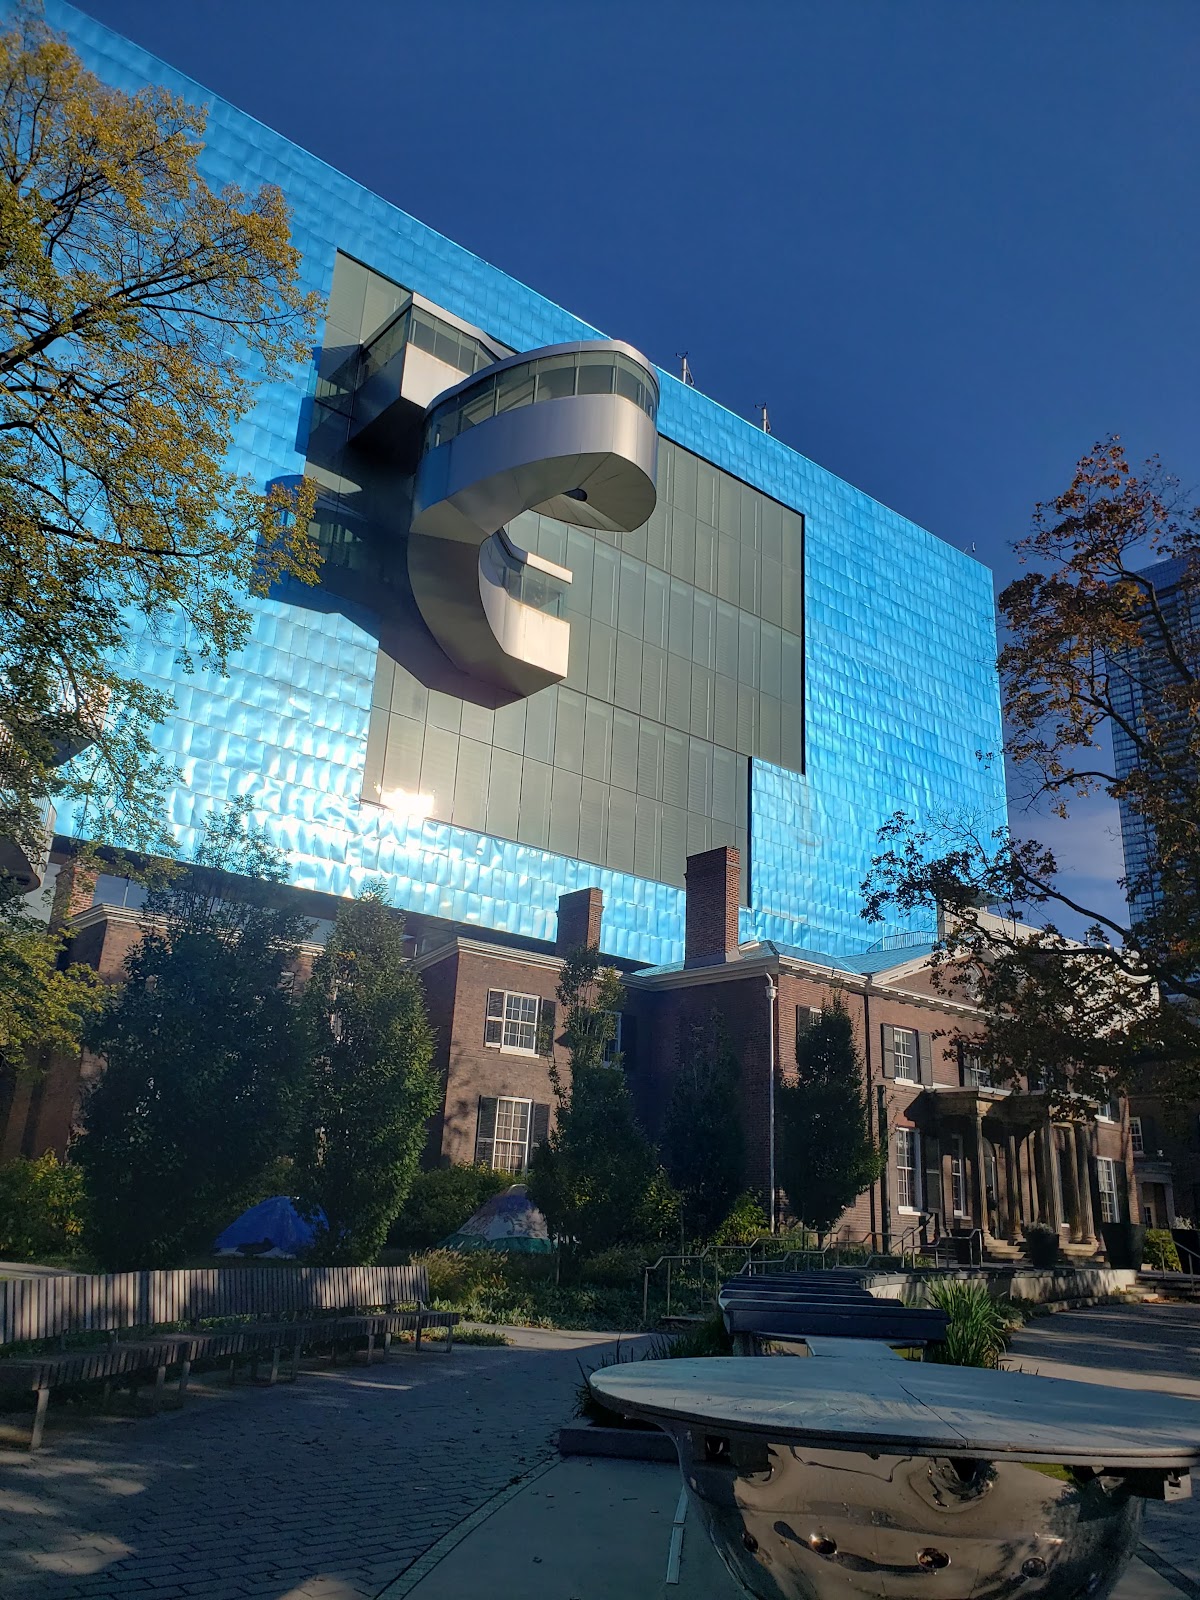
Grange Park
Neighbourhood Park, one of the city's strongest overall (score 60, rank ~100th percentile). Strongest: connectivity; weakest: natural comfort.
Photo by Silvana Klaric Boricic via Google Places · cached 5/9/2026
Grange Park scores 59.7 / 100. Strongest dimensions: enclosure / eyes on park and connectivity. Weakest: amenity diversity (28.4). Border-vacuum risk is low. This score is a transparent reading of Jane Jacobs-style vitality factors, not a definitive judgment.
Area · 1.83 ha
Weighted across six dimensions · confidence 66%
Scores are not bell-curved. Percentiles and expected scores provide context without changing the underlying model.
Loading map…
The parks map is loading.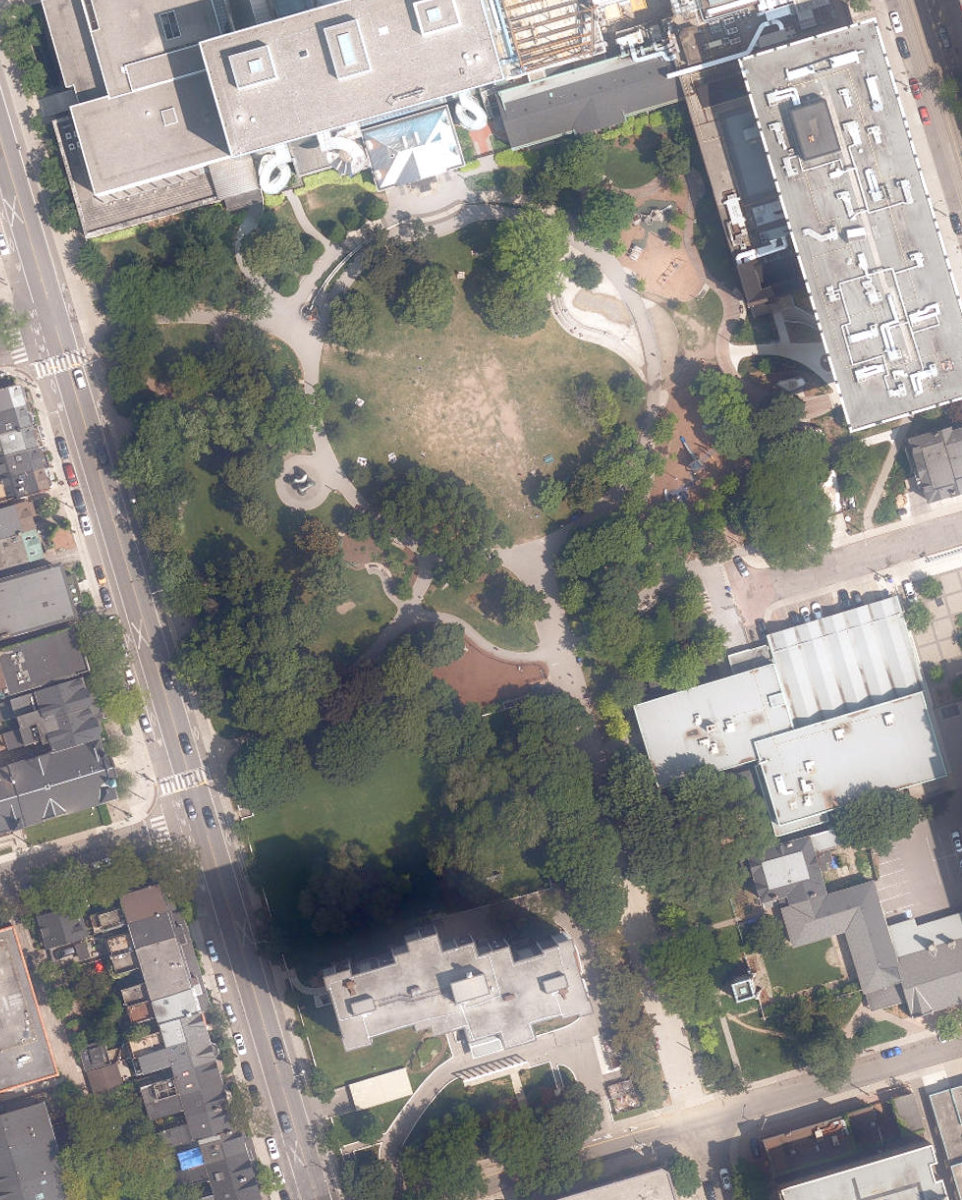
Explain this score
Where did the 60 come from? Each weighted contribution against a neutral 50 baseline. Green = pushed up; red = pulled down.
Sum of contributions = the headline score. A negative bar means that dimension dragged the park below the city-wide neutral baseline.
Why this park works
Grange Park works because its connectivity score (80) is one of the city's strongest and its edge activation (56) is also top decile (32 transit stops sit within a 400 m walk; 22 intersections fall within 100 m of the edge).
What limits this park
Grange Park doesn't have a clear weakness. Every measured dimension is at or above the middle of the pack.
Most distinctive characteristic
Most distinctive feature: exceptionally high connectivity (80, top decile).
Jacobs reading
Grange Park sits between an urban social park and an ecological retreat: moderately useful for both, exceptionally suited to neither.
Tradeoffs
- Connectivity (80) significantly outpaces natural comfort (42): well placed in the city but offers little shade or ecological respite.
- 7 nearby towers cast wind and shadow without contributing canopy: passive surveillance is plentiful but human-scale comfort is not.
Performance in context
- This park is a strong overperformer for its cohort: raw 60 versus an expected 37 for similar parks (medium Neighbourhood Park) (gap +22).
Typology classification
Classified as Neighbourhood Park: 1.8 ha, framed by 52 mid-rise vs 7 towers
Edge Activation
Within 100 m of the park edge: 24 active uses (restaurant, retail, cafe, community) and 3 dead/hostile uses (parking_lot). Active edges keep "eyes on the park" through the day; parking lots, blank institutional walls, rail and highway frontages drain street life.
Source: OSM POIs (amenity/shop) + Toronto Building Footprints + land use
Connectivity
Connectivity blends paths, intersections, transit, entrances, and edge density. This park has 36 mapped paths/walkways and 25 sidewalk segments within 50 m; 22 street intersections within 100 m; 32 transit stops within a 400 m walk; 8 estimated access points across ~725 m of perimeter. edge density is healthy, no superblock penalty. Source coverage: centreline, pedestrian_network, transit_osm.
Source: Toronto Centreline V2 + Pedestrian Network + OSM transit stops
Amenity Diversity
3 distinct amenity types in the park (dog_area, playground, washroom). Diversity, not raw count, drives the score so a park with many distinct activity types can outrank a larger park that repeats the same use.
Source: Toronto Parks & Recreation Facilities + OSM amenity tags
Natural Comfort
Natural-comfort components for this park: ~9.5% effective canopy (0.0% from contiguous tree polygons + scattered tree density); 25 city-mapped trees inside the polygon (13.6/ha). Reading: exposed. Source coverage: street_trees. Impervious surface is approximated (Toronto's authoritative layer ships only as a raster GeoTIFF).
Source: Toronto Treed Area + Ravine + Waterbodies + Street Tree Inventory
Enclosure / Eyes on Park
84 buildings within 25 m of the park edge (52 mid-rise, 25 low-rise, 7 tower); avg edge height 17.5 m (~6 floors); 11.6 buildings per 100 m of 725 m perimeter (strong frontage density); edges are at a Jacobs-scale walkable mid-rise (3 to 7 floors); 7 towers ≥ 40 m within 25 m of the edge. "Eyes on the park" come strongest from the 52 mid-rise edge buildings.
Source: Toronto 3D Massing (building footprints + heights)
Border Vacuum Risk
Border-vacuum factors within 50 m of the park: parking_lot. Jacobs warned that highways, rail, parking lots and blank institutional edges act as "vacuums" that suppress foot traffic and isolate the park from its neighbourhood.
Source: Toronto Street Centreline (highways) + rail layer + OSM landuse + building footprints
Equity Context
Equity Context requires inputs not yet loaded for this park (Toronto Neighbourhood Profiles). Score is held at a neutral 50 with low confidence. Read with caution.
Source: Toronto Neighbourhood Profiles
Amenities (3 types · 3 records)
- dog area
- playground
- washroom
Nearby active-edge features (80)
- community: Toronto Chinese Baptist Church Senior Citizen Centre31 m
- retail: June Hairdresser On Fire36 m
- parking lot45 m
- parking lot53 m
- retail: Cheers Smoke Shop54 m
- cafe: Thor Espresso54 m
- retail: Carolyn McAuley Hair Studio55 m
- restaurant: McDonald's78 m
- cafe: Coffee Exchange80 m
- restaurant: Kezy Döner81 m
- restaurant: Wafflian82 m
- cafe: Ka-Nom83 m
- restaurant: Manpuku83 m
- restaurant: Village by the Grange84 m
- restaurant: La Sani Grill85 m
- restaurant: The Bowl Korean Food85 m
- restaurant: Karine's86 m
- retail: Grange Green Farms88 m
- cafe: Fruiteao91 m
- restaurant: Sushi Cafe Bon Gung92 m
- parking lot93 m
- restaurant: Popeyes94 m
- restaurant: Pho 36994 m
- retail: OCAD U Copy & Print Services94 m
- restaurant: Jaffna Street Food96 m
- restaurant: Thai Bright98 m
- retail: Umbra100 m
- restaurant: Tasty Chinese Food101 m
- restaurant: Black Mill Tea103 m
- retail: Grange Lottery & News104 m
- restaurant: Nai Nai104 m
- parking lot104 m
- restaurant: The Fresh Italian Eatery106 m
- restaurant: Eats Manilla107 m
- retail: Jerk King109 m
- retail: Tibetan Jewelry115 m
- transit stop: Beverley Street115 m
- transit stop: Stephanie Street116 m
- transit stop: Beverley Street116 m
- retail: Lucky Moose Food Mart116 m
- transit stop: McCaul Street118 m
- community: Dorothy H. Hoover Library120 m
- restaurant: Yakiniku Legend120 m
- retail: Pat's Barber Shop120 m
- restaurant: Top Bistro121 m
- retail: GT E-Bike122 m
- cafe: Tuck Shop Provisions123 m
- cafe124 m
- retail: Get Me Fly125 m
- retail: Ye Perfect Nail & Spa127 m
- restaurant: DZO129 m
- retail: Village Custom Cleaners129 m
- retail: Wizard Mart130 m
- retail: 車子130 m
- retail: Queen Dry Cleaners130 m
- restaurant: Pizzaiolo130 m
- retail: Perfect X Hair130 m
- transit stop: McCaul Street132 m
- restaurant: Village Idiot Pub132 m
- retail: Canada Robotix132 m
- retail: Star Vape133 m
- restaurant: Oh My Gyro!133 m
- retail: Perfect Threading & Beauty Salon133 m
- retail: E's House134 m
- retail: i8Yokocho135 m
- restaurant: Chengdu Street Food139 m
- retail: The Tec Fixer139 m
- parking lot140 m
- cafe: The Library Specialty Coffee142 m
- retail: Emy's145 m
- parking lot145 m
- restaurant: Gallery Sushi146 m
- restaurant: Gallery Sushi146 m
- retail: Gardenview Convenience146 m
- retail: Opteaq Eyecare148 m
- cafe: Nord Lyon Cafe149 m
- retail: Tribal Rhythm149 m
- retail: New You Spa149 m
- retail: BMV Books149 m
- restaurant: German Doner Kebab149 m
Park profile
Five-axis radar across the structural dimensions.
Citywide percentile ranks
Across all Toronto parks in the dataset.
- Overall vitality100th
- Edge activation97th
- Connectivity99th
- Amenity diversity95th
- Natural comfort41th
- Enclosure96th
Most similar parks
Closest in metric space across the five structural dimensions.
- Wells Hill ParkParkette61
- Stanley Park South - TorontoAthletic / Recreation Park60
- Masaryk ParkUrban Plaza56
- East Toronto Athletic FieldNeighbourhood Park50
- Trace Manes ParkAthletic / Recreation Park55
Most opposite parks
Furthest in metric space. Useful for recognising what kind of park this isn’t.
- Toronto Islands - Muggs Island ParkRavine / Naturalized Park25
- Trca Lands ( 26)Ravine / Naturalized Park27
- Rouge ParkWaterfront Park25
- Rouge ParkRavine / Naturalized Park28
- Rouge ParkRavine / Naturalized Park26
Human activity signals
Programming, social attention, temporal rhythm, and nearby pedestrian / cycling flow. An experimental aggregate layer that complements the spatial scores. Partial coverage, partial confidence.
Activity reading: 24 events/yr (8 recurring); 1,500 public mentions; pedestrian intensity 70/100; cycling/trail 50/100. The strongest signal is observed pedestrian/cycling activity. These are illustrative sample values. Calibrate before citing.
Sample data: numbers shown here are an illustrative fixture for the 10 named parks, not a measurement.
Does this score feel accurate?
Your read of Grange Parkmatters. We’re testing whether the model lines up with how people actually use the park. Submissions are stored locally; no account needed.
Tell us how this park feels
We measure structure (canopy, edges, connectivity). You measure feeling. Both matter, and disagreement is itself useful civic data.
What would improve this park?
Generated from the weakest measured dimensions: a starting point, not a prescription.
- Diversify what people can do in the park (playground, washroom, water, shade, performance, sport, garden): even small additions raise this score.
- Increase canopy and reduce paved area. Shade and water features extend usable hours and seasons.
Data sources
- City of Toronto Open Data: Parks (Green Space)Polygon boundaries, official names, types.
- Parks & Recreation FacilitiesInventory of in-park amenities (washrooms, fields, rinks…).
- Toronto Pedestrian NetworkSidewalk segments around and through parks; estimated park entrances.
- Toronto Centreline V2Street segments + intersection nodes near park edges; trails and walkways.
- Toronto 3D MassingBuilding footprints + heights for edge-building counts, frontage density, and tower-in-the-park risk.
- Toronto Treed AreaTree canopy share inside park polygons via stratified-grid sampling.
- Toronto Waterbodies & RiversWater surface inside parks + nearest-water distance for cooling.
- Ravine & Natural Feature ProtectionRavine overlap as a cooling / natural-comfort signal.
- Toronto Street Tree InventoryTree count + density inside park polygons.
- Neighbourhood Profiles(Pending) Equity context proxy.
- OpenStreetMap (Overpass API)Cafés, restaurants, retail, transit stops, parking, highways, rail.