Weston Golf And Country Club
Ravine / Naturalized Park, below average overall (score 28, rank ~22th percentile). Strongest: natural comfort; weakest: edge activation.
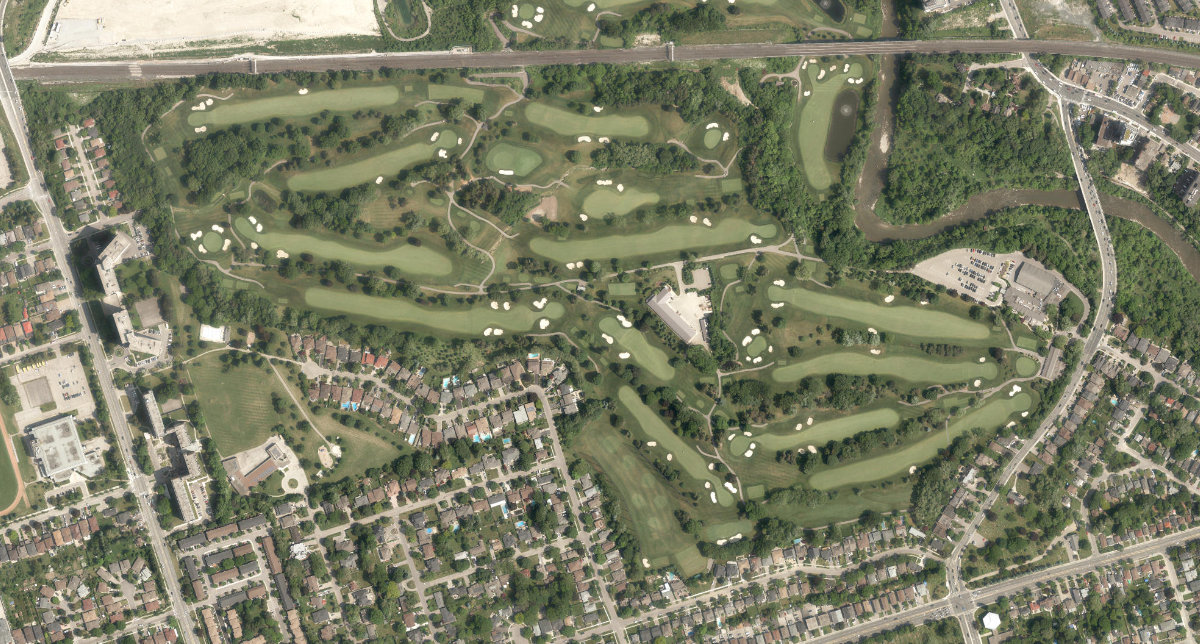
Aerial, City of Toronto orthophoto, ~8 cm/px source · cached 5/9/2026
Weston Golf And Country Club scores 27.9 / 100. Strongest dimensions: natural comfort and connectivity. Weakest: amenity diversity (0). Border-vacuum risk is elevated (100). This score is a transparent reading of Jane Jacobs-style vitality factors, not a definitive judgment.
Area · 62.63 ha
Weighted across six dimensions · confidence 63%
Scores are not bell-curved. Percentiles and expected scores provide context without changing the underlying model.
Loading map…
The parks map is loading.Explain this score
Where did the 28 come from? Each weighted contribution against a neutral 50 baseline. Green = pushed up; red = pulled down.
Sum of contributions = the headline score. A negative bar means that dimension dragged the park below the city-wide neutral baseline.
Why this park works
Weston Golf And Country Club works because its natural comfort score (68) is above average and its connectivity (60) is also above-average (it sits inside the ravine system).
What limits this park
Weston Golf And Country Club is held back by edge activation (0, bottom quartile): the surrounding streets carry too few active uses to spill into the park; border-vacuum risk is also elevated (100).
Most distinctive characteristic
Most distinctive feature: exceptionally low edge activation (0, bottom quartile).
Jacobs reading
Weston Golf And Country Club is currently underperforming on both axes: neither integrated into the city nor offering deep natural respite. A candidate for design intervention.
Tradeoffs
- High connectivity coexists with high border-vacuum risk (100): much of that connectivity is to highways, rail, or parking lots, not to neighbourhoods.
Performance in context
- Reads as a modest underperformer relative to comparable parks (gap -6; cohort: very large Ravine / Naturalized Park ravine).
Typology classification
Classified as Ravine / Naturalized Park: 81% ravine overlap, 24% canopy. Secondary read: Waterfront Park (nearest waterbody within ~0 m).
Edge Activation
Within 100 m of the park edge: 5 active uses (retail, transit_stop) and 27 dead/hostile uses (parking_lot, rail). Active edges keep "eyes on the park" through the day; parking lots, blank institutional walls, rail and highway frontages drain street life.
Source: OSM POIs (amenity/shop) + Toronto Building Footprints + land use
Connectivity
Connectivity blends paths, intersections, transit, entrances, and edge density. This park has 6 mapped paths/walkways and 29 sidewalk segments within 50 m; 13 street intersections within 100 m; 32 transit stops within a 400 m walk; 1 estimated access points across ~4,056 m of perimeter. low edge density, significant superblock penalty applied. Source coverage: centreline, pedestrian_network, transit_osm.
Source: Toronto Centreline V2 + Pedestrian Network + OSM transit stops
Amenity Diversity
No amenities recorded. Score is 0 until inventory is loaded.
Source: Toronto Parks & Recreation Facilities + OSM amenity tags
Natural Comfort
Natural-comfort components for this park: 24.4% estimated tree canopy; 80.7% inside the ravine system; 3.3% water surface; 12 city-mapped trees inside the polygon (0.2/ha). Reading: ravine-cooled. Source coverage: treed_area, ravine, waterbodies, street_trees. Impervious surface is approximated (Toronto's authoritative layer ships only as a raster GeoTIFF).
Source: Toronto Treed Area + Ravine + Waterbodies + Street Tree Inventory
Enclosure / Eyes on Park
210 buildings within 25 m of the park edge (1 mid-rise, 207 low-rise, 2 tower); avg edge height 5.8 m (~2 floors); 5.2 buildings per 100 m of 4,056 m perimeter (strong frontage density); edges are barely there or single-storey; 2 towers ≥ 40 m within 25 m of the edge. "Eyes on the park" come strongest from the 1 mid-rise edge buildings.
Source: Toronto 3D Massing (building footprints + heights)
Border Vacuum Risk
Border-vacuum factors within 50 m of the park: parking_lot, Weston Subdivision, rail, GO Transit - Weston Subdivision, GO Transit Weston Subdivision, rail, rail, rail, rail, Weston Subdivision, Weston Subdivision, Weston Subdivision, Weston Subdivision, parking_lot, Weston Subdivision, Weston Subdivision, GO Transit Weston Subdivision, GO Transit Weston Subdivision, Weston Subdivision. Jacobs warned that highways, rail, parking lots and blank institutional edges act as "vacuums" that suppress foot traffic and isolate the park from its neighbourhood.
Source: Toronto Street Centreline (highways) + rail layer + OSM landuse + building footprints
Equity Context
Equity Context requires inputs not yet loaded for this park (Toronto Neighbourhood Profiles). Score is held at a neutral 50 with low confidence. Read with caution.
Source: Toronto Neighbourhood Profiles
Amenities (0)
No amenities recorded for this park.
Nearby active-edge features (75)
- parking lot0 m
- transit stop: St Phillips Rd at Riverview Heights3 m
- rail: Weston Subdivision4 m
- rail: Weston Subdivision8 m
- rail9 m
- rail: Weston Subdivision11 m
- rail: Weston Subdivision12 m
- rail: GO Transit - Weston Subdivision12 m
- rail14 m
- rail15 m
- rail: GO Transit Weston Subdivision16 m
- rail: Weston Subdivision17 m
- rail17 m
- rail: GO Transit Weston Subdivision19 m
- parking lot20 m
- rail: Weston Subdivision20 m
- rail20 m
- rail: Weston Subdivision20 m
- transit stop: St Phillips Rd at Riverview Heights23 m
- rail: GO Transit Weston Subdivision32 m
- rail: Weston Subdivision35 m
- transit stop: St Phillips Rd at Weston Rd55 m
- parking lot70 m
- parking lot71 m
- parking lot83 m
- parking lot87 m
- retail: Weston Motors89 m
- rail: Weston Subdivision96 m
- rail96 m
- rail: Weston Subdivision97 m
- rail: Weston Subdivision97 m
- transit stop: St Phillips Rd at Dixon Rd99 m
- transit stop: St Phillips Rd100 m
- transit stop104 m
- transit stop: Weston Rd at St Phillips Rd117 m
- parking lot119 m
- parking lot119 m
- transit stop: Dixon Rd at St. Phillips Rd125 m
- parking lot126 m
- parking lot130 m
- parking lot134 m
- transit stop137 m
- parking lot138 m
- parking lot138 m
- transit stop140 m
- transit stop: St Georges Boulevard140 m
- parking lot141 m
- parking lot141 m
- transit stop: Golfwood Heights151 m
- retail: Seif Halal Food Market151 m
- parking lot152 m
- transit stop: Dixon Road154 m
- transit stop: Dixon Rd at Royal York Rd156 m
- retail: Weston Motors156 m
- retail: Traditional Fashion & Beauty Supply157 m
- retail: Home Town Convenience159 m
- restaurant: Kebab Pizza161 m
- parking lot163 m
- parking lot165 m
- rail: Weston Subdivision166 m
- parking lot166 m
- rail: Weston Subdivision171 m
- rail174 m
- rail: Weston Subdivision175 m
- rail: GO Transit Weston Subdivision177 m
- transit stop: Weston Rd at Oak St183 m
- restaurant: Alder & The Sparrow Restaurant & Bar184 m
- rail: Weston Subdivision185 m
- retail: Beams Beauty Salon & Supply187 m
- rail: Weston Subdivision188 m
- retail190 m
- transit stop192 m
- parking lot192 m
- transit stop: Golfwood Heights195 m
- retail: Lavello Nails and Beauty Spa196 m
Park profile
Five-axis radar across the structural dimensions.
Citywide percentile ranks
Across all Toronto parks in the dataset.
- Overall vitality22th
- Edge activation17th
- Connectivity74th
- Amenity diversity26th
- Natural comfort82th
- Enclosure25th
Most similar parks
Closest in metric space across the five structural dimensions.
- Hampshire Heights ParkWaterfront Park37
- Charles Sauriol Conservation AreaRavine / Naturalized Park38
- Oakdale Golf And Country ClubRavine / Naturalized Park29
- Donalda ClubWaterfront Park29
- Crawford - Jones Memorial ParkWaterfront Park30
Most opposite parks
Furthest in metric space. Useful for recognising what kind of park this isn’t.
- Leslie Grove ParkParkette68
- ALEX WILSON COMMUNITY GARDEN - Open Green SpaceUrban Plaza59
- Joseph Burr Tyrrell ParkUrban Plaza50
- Bernard Avenue Road AllowanceUrban Plaza54
- Sonya'S ParkUrban Plaza60
Human activity signals: not available
No activity signals have landed for this park yet. The model has scored its physical form but it can’t yet say how often it’s programmed, photographed, or walked through. See /data-ethics for what we will and will not collect.
Does this score feel accurate?
Your read of Weston Golf And Country Clubmatters. We’re testing whether the model lines up with how people actually use the park. Submissions are stored locally; no account needed.
Tell us how this park feels
We measure structure (canopy, edges, connectivity). You measure feeling. Both matter, and disagreement is itself useful civic data.
What would improve this park?
Generated from the weakest measured dimensions: a starting point, not a prescription.
- Activate the edges: encourage cafés, retail or community uses on the streets that face the park; replace blank or parking-lot edges where possible.
- Diversify what people can do in the park (playground, washroom, water, shade, performance, sport, garden): even small additions raise this score.
- Mitigate border vacuums (highways, rail, parking) with active programming on the still-permeable edges and treat the hostile edge as a design challenge.
Data sources
- City of Toronto Open Data: Parks (Green Space)Polygon boundaries, official names, types.
- Parks & Recreation FacilitiesInventory of in-park amenities (washrooms, fields, rinks…).
- Toronto Pedestrian NetworkSidewalk segments around and through parks; estimated park entrances.
- Toronto Centreline V2Street segments + intersection nodes near park edges; trails and walkways.
- Toronto 3D MassingBuilding footprints + heights for edge-building counts, frontage density, and tower-in-the-park risk.
- Toronto Treed AreaTree canopy share inside park polygons via stratified-grid sampling.
- Toronto Waterbodies & RiversWater surface inside parks + nearest-water distance for cooling.
- Ravine & Natural Feature ProtectionRavine overlap as a cooling / natural-comfort signal.
- Toronto Street Tree InventoryTree count + density inside park polygons.
- Neighbourhood Profiles(Pending) Equity context proxy.
- OpenStreetMap (Overpass API)Cafés, restaurants, retail, transit stops, parking, highways, rail.