City Wide Open Space
Tower-Community Green Space, near the bottom of the city overall (score 20, rank ~3th percentile). Strongest: natural comfort; weakest: enclosure.
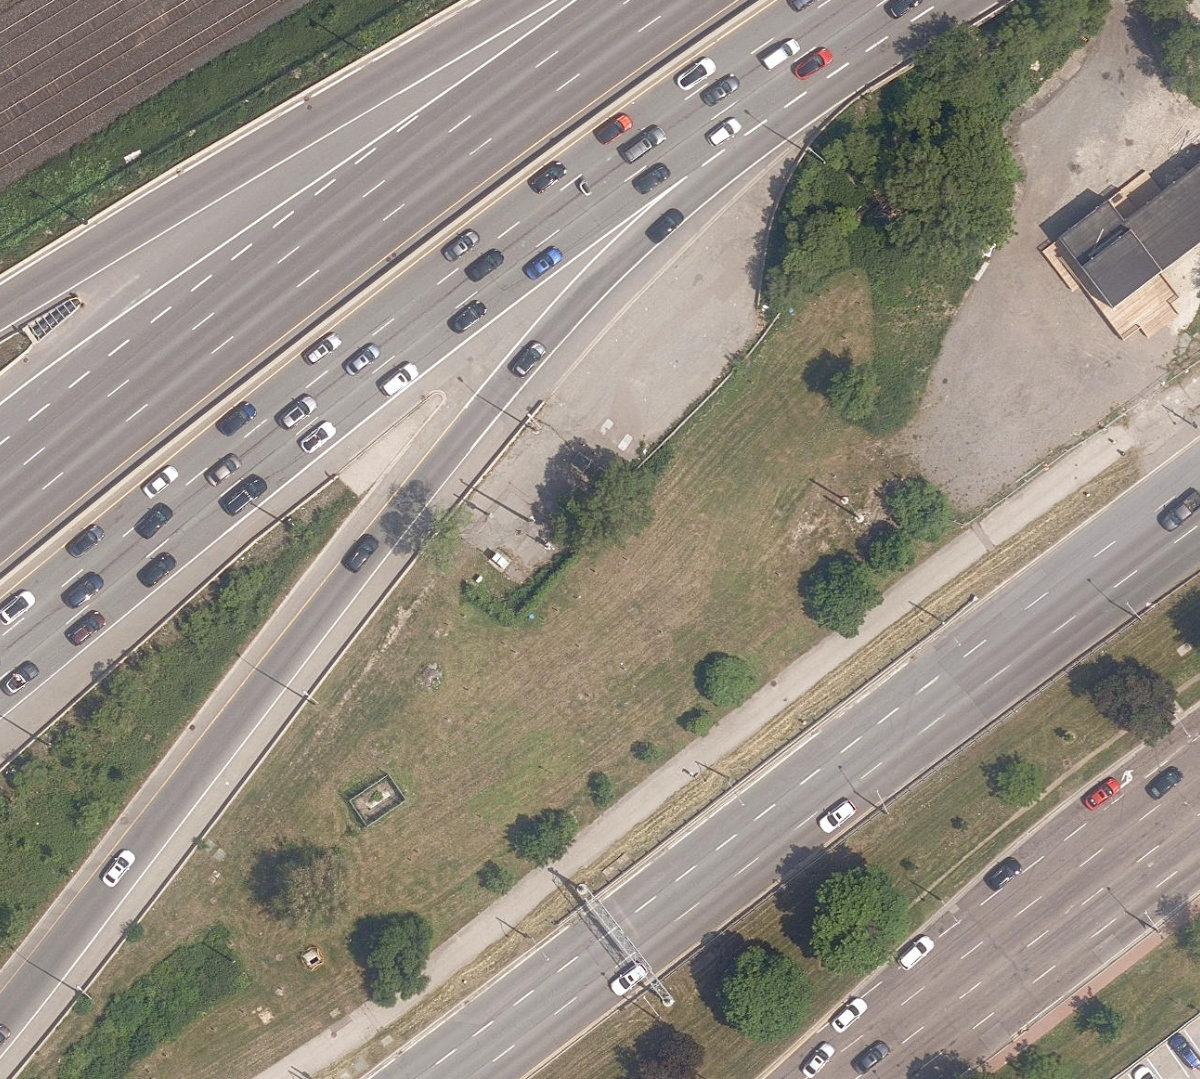
Aerial, City of Toronto orthophoto, ~8 cm/px source · cached 5/9/2026
City Wide Open Space scores 20.1 / 100. Strongest dimensions: natural comfort and connectivity. Weakest: amenity diversity (0). Border-vacuum risk is elevated (100). This score is a transparent reading of Jane Jacobs-style vitality factors, not a definitive judgment.
Area · 0.51 ha
Weighted across six dimensions · confidence 59%
Scores are not bell-curved. Percentiles and expected scores provide context without changing the underlying model.
Loading map…
The parks map is loading.Explain this score
Where did the 20 come from? Each weighted contribution against a neutral 50 baseline. Green = pushed up; red = pulled down.
Sum of contributions = the headline score. A negative bar means that dimension dragged the park below the city-wide neutral baseline.
Why this park works
City Wide Open Space doesn't have a clear standout dimension. The strongest measured signal is natural comfort, and even that is below the city median.
What limits this park
City Wide Open Space is held back by enclosure (36, bottom quartile); border-vacuum risk is also elevated (100).
Most distinctive characteristic
Most distinctive feature: exceptionally low enclosure (36, bottom quartile).
Jacobs reading
City Wide Open Space is currently underperforming on both axes: neither integrated into the city nor offering deep natural respite. A candidate for design intervention.
Tradeoffs
- 8 nearby towers cast wind and shadow without contributing canopy: passive surveillance is plentiful but human-scale comfort is not.
Performance in context
- Reads as a modest underperformer relative to comparable parks (gap -9; cohort: small Tower-Community Green Space).
Typology classification
Classified as Tower-Community Green Space: 8 towers vs 1 mid-rise within 25 m on a 0.5 ha park
Edge Activation
Within 100 m of the park edge: 1 active uses (transit_stop) and 21 dead/hostile uses (highway, rail, parking_lot). Active edges keep "eyes on the park" through the day; parking lots, blank institutional walls, rail and highway frontages drain street life.
Source: OSM POIs (amenity/shop) + Toronto Building Footprints + land use
Connectivity
Connectivity blends paths, intersections, transit, entrances, and edge density. This park has 2 mapped paths/walkways and 6 sidewalk segments within 50 m; 7 street intersections within 100 m; 19 transit stops within a 400 m walk; 0 estimated access points across ~319 m of perimeter. low edge density, significant superblock penalty applied. Source coverage: centreline, pedestrian_network, transit_osm.
Source: Toronto Centreline V2 + Pedestrian Network + OSM transit stops
Amenity Diversity
No amenities recorded. Score is 0 until inventory is loaded.
Source: Toronto Parks & Recreation Facilities + OSM amenity tags
Natural Comfort
Natural-comfort components for this park: ~14.7% effective canopy (0.0% from contiguous tree polygons + scattered tree density); nearest waterbody ~150 m; 21 city-mapped trees inside the polygon (21.0/ha). Reading: water-cooled. Source coverage: waterbodies, street_trees. Impervious surface is approximated (Toronto's authoritative layer ships only as a raster GeoTIFF).
Source: Toronto Treed Area + Ravine + Waterbodies + Street Tree Inventory
Enclosure / Eyes on Park
9 buildings within 25 m of the park edge (1 mid-rise, 0 low-rise, 8 tower); avg edge height 100.9 m (~34 floors); 2.8 buildings per 100 m of 319 m perimeter (moderate frontage density); edges dominated by towers; 8 towers ≥ 40 m within 25 m of the edge. "Eyes on the park" come strongest from the 1 mid-rise edge buildings.
Source: Toronto 3D Massing (building footprints + heights)
Border Vacuum Risk
Border-vacuum factors within 50 m of the park: Gardiner Expressway, Gardiner Expressway, Gardiner Expressway, Gardiner Expressway, Gardiner Expressway, Gardiner Expressway, Lake Shore Boulevard West, Lake Shore Boulevard West, Gardiner Expressway. Jacobs warned that highways, rail, parking lots and blank institutional edges act as "vacuums" that suppress foot traffic and isolate the park from its neighbourhood.
Source: Toronto Street Centreline (highways) + rail layer + OSM landuse + building footprints
Equity Context
Equity Context requires inputs not yet loaded for this park (Toronto Neighbourhood Profiles). Score is held at a neutral 50 with low confidence. Read with caution.
Source: Toronto Neighbourhood Profiles
Amenities (0)
No amenities recorded for this park.
Nearby active-edge features (37)
- highway: Lake Shore Boulevard West0 m
- highway: Gardiner Expressway0 m
- highway: Gardiner Expressway17 m
- highway: Gardiner Expressway20 m
- highway: Gardiner Expressway28 m
- highway: Gardiner Expressway30 m
- highway: Gardiner Expressway42 m
- highway: Lake Shore Boulevard West48 m
- highway: Gardiner Expressway50 m
- rail: Oakville Subdivision52 m
- rail: Oakville Subdivision56 m
- transit stop: Windermere Avenue57 m
- rail: Oakville Subdivision60 m
- rail: Oakville Subdivision64 m
- rail: Oakville Subdivision64 m
- rail: Oakville Subdivision68 m
- rail: Oakville Subdivision70 m
- highway: Lake Shore Boulevard West73 m
- rail: Oakville Subdivision74 m
- parking lot75 m
- highway: Gardiner Expressway85 m
- highway: Lake Shore Boulevard West93 m
- highway: Gardiner Expressway126 m
- parking lot127 m
- highway: Lake Shore Boulevard West131 m
- highway: Gardiner Expressway151 m
- highway: Gardiner Expressway161 m
- highway: Gardiner Expressway163 m
- rail: Oakville Subdivision172 m
- rail: Oakville Subdivision173 m
- rail: Oakville Subdivision174 m
- rail: Oakville Subdivision176 m
- rail: Oakville Subdivision181 m
- highway: Lake Shore Boulevard West182 m
- rail: Oakville Subdivision183 m
- rail: Oakville Subdivision184 m
- rail: Oakville Subdivision185 m
Park profile
Five-axis radar across the structural dimensions.
Citywide percentile ranks
Across all Toronto parks in the dataset.
- Overall vitality3th
- Edge activation50th
- Connectivity45th
- Amenity diversity55th
- Natural comfort59th
- Enclosure7th
Most similar parks
Closest in metric space across the five structural dimensions.
- Thorncliffe Allotment GardensOther30
- Flemingdon Park Golf ClubWaterfront Park26
- Humber River WatercourseWaterfront Park29
- NORTHLINE PARKS YARD - Building GroundsOther29
- City Wide Open SpaceOther19
Most opposite parks
Furthest in metric space. Useful for recognising what kind of park this isn’t.
- Leslie Grove ParkParkette68
- ALEX WILSON COMMUNITY GARDEN - Open Green SpaceUrban Plaza59
- Kew GardensNeighbourhood Park71
- Market Lane ParkUrban Plaza63
- Bellevue Square ParkCivic Square66
Human activity signals: not available
No activity signals have landed for this park yet. The model has scored its physical form but it can’t yet say how often it’s programmed, photographed, or walked through. See /data-ethics for what we will and will not collect.
Does this score feel accurate?
Your read of City Wide Open Spacematters. We’re testing whether the model lines up with how people actually use the park. Submissions are stored locally; no account needed.
Tell us how this park feels
We measure structure (canopy, edges, connectivity). You measure feeling. Both matter, and disagreement is itself useful civic data.
What would improve this park?
Generated from the weakest measured dimensions: a starting point, not a prescription.
- Activate the edges: encourage cafés, retail or community uses on the streets that face the park; replace blank or parking-lot edges where possible.
- Add or open more entrances and improve sidewalk continuity around the park. More permeability means more spontaneous use.
- Diversify what people can do in the park (playground, washroom, water, shade, performance, sport, garden): even small additions raise this score.
- Increase canopy and reduce paved area. Shade and water features extend usable hours and seasons.
- Encourage mid-rise, windowed frontages around the park so residents have direct sightlines onto it.
- Mitigate border vacuums (highways, rail, parking) with active programming on the still-permeable edges and treat the hostile edge as a design challenge.
Data sources
- City of Toronto Open Data: Parks (Green Space)Polygon boundaries, official names, types.
- Parks & Recreation FacilitiesInventory of in-park amenities (washrooms, fields, rinks…).
- Toronto Pedestrian NetworkSidewalk segments around and through parks; estimated park entrances.
- Toronto Centreline V2Street segments + intersection nodes near park edges; trails and walkways.
- Toronto 3D MassingBuilding footprints + heights for edge-building counts, frontage density, and tower-in-the-park risk.
- Toronto Treed AreaTree canopy share inside park polygons via stratified-grid sampling.
- Toronto Waterbodies & RiversWater surface inside parks + nearest-water distance for cooling.
- Ravine & Natural Feature ProtectionRavine overlap as a cooling / natural-comfort signal.
- Toronto Street Tree InventoryTree count + density inside park polygons.
- Neighbourhood Profiles(Pending) Equity context proxy.
- OpenStreetMap (Overpass API)Cafés, restaurants, retail, transit stops, parking, highways, rail.