St. James Cemetery
Ravine / Naturalized Park, middle of the pack overall (score 39, rank ~69th percentile). Strongest: connectivity; weakest: edge activation.
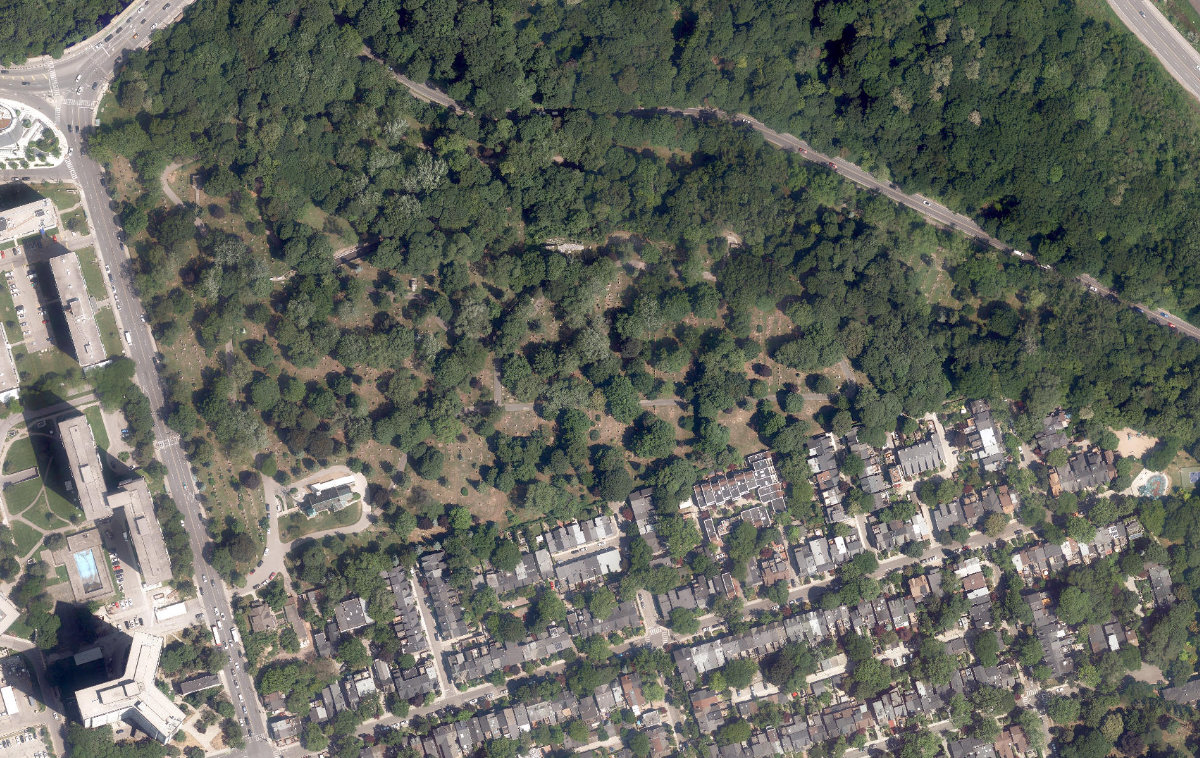
Aerial, City of Toronto orthophoto, ~8 cm/px source · cached 5/9/2026
St. James Cemetery scores 38.5 / 100. Strongest dimensions: enclosure / eyes on park and connectivity. Weakest: amenity diversity (0). Border-vacuum risk is low. This score is a transparent reading of Jane Jacobs-style vitality factors, not a definitive judgment.
Area · 12.03 ha
Weighted across six dimensions · confidence 63%
Scores are not bell-curved. Percentiles and expected scores provide context without changing the underlying model.
Loading map…
The parks map is loading.Explain this score
Where did the 39 come from? Each weighted contribution against a neutral 50 baseline. Green = pushed up; red = pulled down.
Sum of contributions = the headline score. A negative bar means that dimension dragged the park below the city-wide neutral baseline.
Why this park works
St. James Cemetery works because its connectivity score (75) is one of the city's strongest and its enclosure (83) is also top quartile (21 transit stops sit within a 400 m walk; 52 intersections fall within 100 m of the edge).
What limits this park
.
Most distinctive characteristic
Most distinctive feature: exceptionally high connectivity (75, top decile).
Jacobs reading
St. James Cemetery sits between an urban social park and an ecological retreat: moderately useful for both, exceptionally suited to neither.
Tradeoffs
- The park is enclosed by buildings (83) but the surrounding streets are quiet (edge activation 0): frame without animation.
Typology classification
Classified as Ravine / Naturalized Park: 42% ravine overlap, 2% canopy. Secondary read: Neighbourhood Park (12.0 ha, framed by 43 mid-rise vs 11 towers).
Edge Activation
Within 100 m of the park edge: 22 active uses (transit_stop, retail, cafe, restaurant, community) and 10 dead/hostile uses (parking_lot, highway). Active edges keep "eyes on the park" through the day; parking lots, blank institutional walls, rail and highway frontages drain street life.
Source: OSM POIs (amenity/shop) + Toronto Building Footprints + land use
Connectivity
Connectivity blends paths, intersections, transit, entrances, and edge density. This park has 2 mapped paths/walkways and 57 sidewalk segments within 50 m; 52 street intersections within 100 m; 21 transit stops within a 400 m walk; 2 estimated access points across ~1,677 m of perimeter. edge density is healthy, no superblock penalty. Source coverage: centreline, pedestrian_network, transit_osm.
Source: Toronto Centreline V2 + Pedestrian Network + OSM transit stops
Amenity Diversity
No amenities recorded. Score is 0 until inventory is loaded.
Source: Toronto Parks & Recreation Facilities + OSM amenity tags
Natural Comfort
Natural-comfort components for this park: 2.0% estimated tree canopy; 41.5% inside the ravine system; nearest waterbody ~452 m; 36 city-mapped trees inside the polygon (3.0/ha). Reading: ravine-cooled. Source coverage: treed_area, ravine, waterbodies, street_trees. Impervious surface is approximated (Toronto's authoritative layer ships only as a raster GeoTIFF).
Source: Toronto Treed Area + Ravine + Waterbodies + Street Tree Inventory
Enclosure / Eyes on Park
113 buildings within 25 m of the park edge (43 mid-rise, 59 low-rise, 11 tower); avg edge height 14.7 m (~5 floors); 6.7 buildings per 100 m of 1,677 m perimeter (strong frontage density); edges are at a Jacobs-scale walkable mid-rise (3 to 7 floors); 11 towers ≥ 40 m within 25 m of the edge. "Eyes on the park" come strongest from the 43 mid-rise edge buildings.
Source: Toronto 3D Massing (building footprints + heights)
Border Vacuum Risk
Border-vacuum factors within 50 m of the park: parking_lot, parking_lot. Jacobs warned that highways, rail, parking lots and blank institutional edges act as "vacuums" that suppress foot traffic and isolate the park from its neighbourhood.
Source: Toronto Street Centreline (highways) + rail layer + OSM landuse + building footprints
Equity Context
Equity Context requires inputs not yet loaded for this park (Toronto Neighbourhood Profiles). Score is held at a neutral 50 with low confidence. Read with caution.
Source: Toronto Neighbourhood Profiles
Amenities (0)
No amenities recorded for this park.
Nearby active-edge features (77)
- transit stop: St James Avenue1 m
- transit stop: Wellesley Street East2 m
- transit stop: Howard Street15 m
- transit stop: St James Avenue20 m
- transit stop: Howard Street20 m
- restaurant: BBQ Chicken Factory25 m
- parking lot34 m
- parking lot40 m
- transit stop: Wellesley Street East50 m
- retail: Parliament Smoke & Gift52 m
- restaurant: Rashnaa54 m
- parking lot55 m
- retail: Jamestown Milk55 m
- highway: Bloor Street East56 m
- highway: Bloor Street East57 m
- retail: Yaris Super Store58 m
- parking lot59 m
- cafe: KAVA COFFE HOUSE59 m
- transit stop: Wellesley Street East59 m
- parking lot61 m
- parking lot67 m
- retail: La Vape68 m
- transit stop: Parliament Street68 m
- parking lot68 m
- restaurant: Pizza Pizza68 m
- restaurant: Cranberries Restaurant70 m
- retail: Alemey Beauty Supply78 m
- retail: Wan2 supermarket80 m
- highway: Bloor Street East83 m
- restaurant: Tender Trap84 m
- community: The Filipino Centre Toronto85 m
- retail: FTJ Co Fine Jewellery99 m
- retail: Rose Park Tuck Shop103 m
- highway: Bloor Street East105 m
- retail: Ambal Trading110 m
- parking lot113 m
- retail: The Bestiary115 m
- retail: Absolute Bakery & Cafe116 m
- restaurant: Shalom120 m
- restaurant: Falacha Fusion121 m
- restaurant: Momo Ghar121 m
- rail: Bloor-Danforth Line122 m
- restaurant: Poopathy Mess125 m
- rail: Bloor-Danforth Line126 m
- rail: Bloor-Danforth Line127 m
- retail: Kalaimakal Convenience127 m
- highway: Bloor Street East127 m
- restaurant: L'avenue on Parliament129 m
- rail: Bloor-Danforth Line130 m
- restaurant: F'Amelia132 m
- rail: Bloor-Danforth Line141 m
- transit stop: Bloor Street144 m
- rail: Bloor-Danforth Line145 m
- restaurant: Butter Chicken Factory146 m
- parking lot149 m
- parking lot150 m
- parking lot153 m
- cafe: Tim Hortons158 m
- transit stop: Castle Frank162 m
- parking lot164 m
- highway: Bloor Street East164 m
- transit stop: Castle Frank173 m
- rail: Bloor-Danforth Line173 m
- parking lot176 m
- transit stop: Castle Frank176 m
- rail: Bloor-Danforth Line176 m
- retail: Harla Spice Market176 m
- retail: T & B Hair Salon176 m
- community: Rose Avenue Community Centre176 m
- retail: Philippine Variety Store177 m
- restaurant: Luis Hernandez Restaurant178 m
- restaurant: Alice's Place182 m
- transit stop: Castle Frank Road184 m
- retail: Powder Bride191 m
- retail: Blooming Flower Bar191 m
- highway: Bloor Street East195 m
- rail: Rosedale Siding198 m
Park profile
Five-axis radar across the structural dimensions.
Citywide percentile ranks
Across all Toronto parks in the dataset.
- Overall vitality69th
- Edge activation53th
- Connectivity95th
- Amenity diversity59th
- Natural comfort62th
- Enclosure88th
Most similar parks
Closest in metric space across the five structural dimensions.
- Duplex ParketteRavine / Naturalized Park32
- St. John'S Norway CemeteryRavine / Naturalized Park30
- East York Hydro Green SpaceCorridor / Linear Park33
- Beaty Boulevard ParketteCorridor / Linear Park38
- Garrison Creek ParkRavine / Naturalized Park31
Most opposite parks
Furthest in metric space. Useful for recognising what kind of park this isn’t.
- Toronto Islands - Muggs Island ParkRavine / Naturalized Park25
- Trca Lands ( 26)Ravine / Naturalized Park27
- Rouge ParkRavine / Naturalized Park21
- Rouge ParkWaterfront Park25
- Toronto Islands - Island ParkWaterfront Park52
Human activity signals: not available
No activity signals have landed for this park yet. The model has scored its physical form but it can’t yet say how often it’s programmed, photographed, or walked through. See /data-ethics for what we will and will not collect.
Does this score feel accurate?
Your read of St. James Cemeterymatters. We’re testing whether the model lines up with how people actually use the park. Submissions are stored locally; no account needed.
Tell us how this park feels
We measure structure (canopy, edges, connectivity). You measure feeling. Both matter, and disagreement is itself useful civic data.
What would improve this park?
Generated from the weakest measured dimensions: a starting point, not a prescription.
- Activate the edges: encourage cafés, retail or community uses on the streets that face the park; replace blank or parking-lot edges where possible.
- Diversify what people can do in the park (playground, washroom, water, shade, performance, sport, garden): even small additions raise this score.
Data sources
- City of Toronto Open Data: Parks (Green Space)Polygon boundaries, official names, types.
- Parks & Recreation FacilitiesInventory of in-park amenities (washrooms, fields, rinks…).
- Toronto Pedestrian NetworkSidewalk segments around and through parks; estimated park entrances.
- Toronto Centreline V2Street segments + intersection nodes near park edges; trails and walkways.
- Toronto 3D MassingBuilding footprints + heights for edge-building counts, frontage density, and tower-in-the-park risk.
- Toronto Treed AreaTree canopy share inside park polygons via stratified-grid sampling.
- Toronto Waterbodies & RiversWater surface inside parks + nearest-water distance for cooling.
- Ravine & Natural Feature ProtectionRavine overlap as a cooling / natural-comfort signal.
- Toronto Street Tree InventoryTree count + density inside park polygons.
- Neighbourhood Profiles(Pending) Equity context proxy.
- OpenStreetMap (Overpass API)Cafés, restaurants, retail, transit stops, parking, highways, rail.