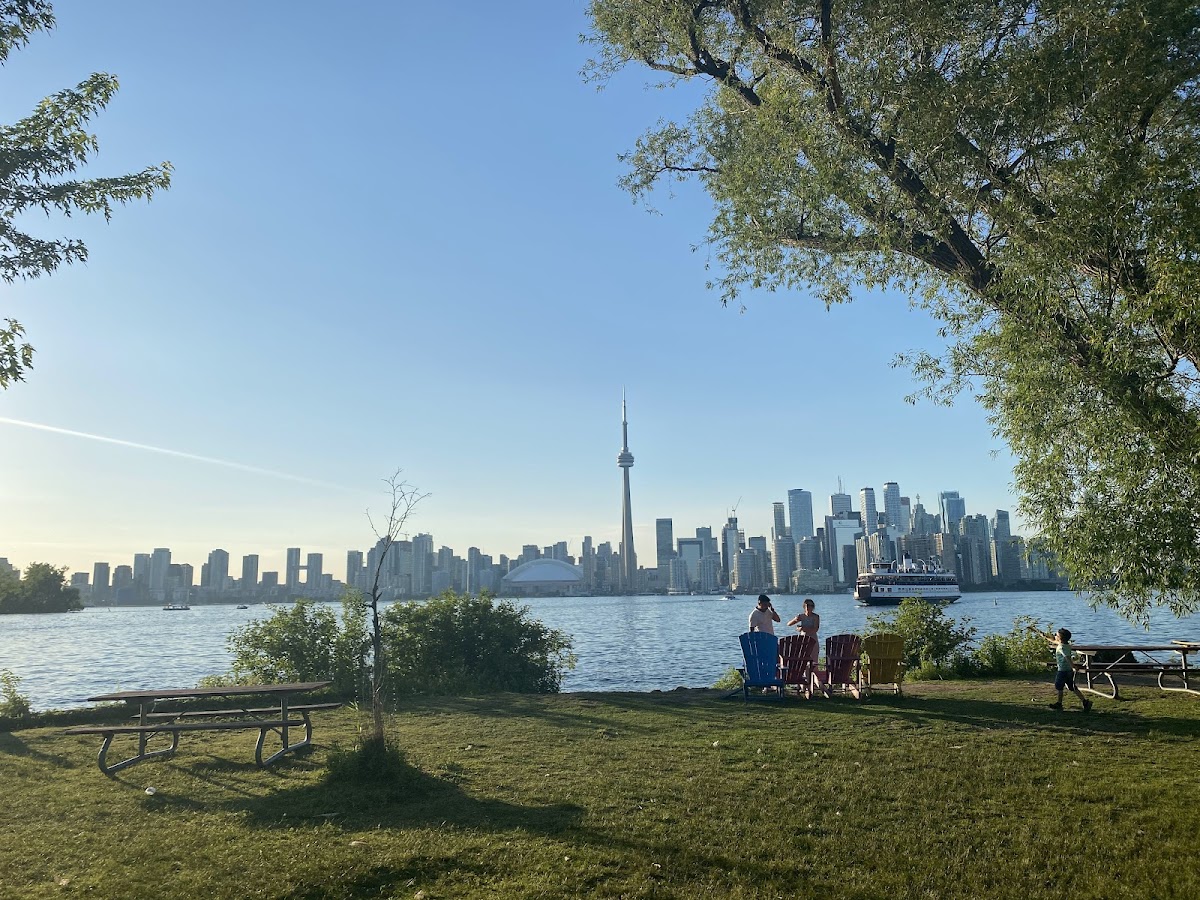
Toronto Islands - Island Park
Waterfront Park, one of the city's strongest overall (score 52, rank ~97th percentile). Strongest: edge activation; weakest: enclosure.
Photo by Prashant Dc via Google Places · cached 5/9/2026
Toronto Islands - Island Park scores 52.3 / 100. Strongest dimensions: edge activation and natural comfort. Weakest: amenity diversity (28.4). Border-vacuum risk is low. This score is a transparent reading of Jane Jacobs-style vitality factors, not a definitive judgment.
Area · 30.80 ha
Weighted across six dimensions · confidence 72%
Scores are not bell-curved. Percentiles and expected scores provide context without changing the underlying model.
Loading map…
The parks map is loading.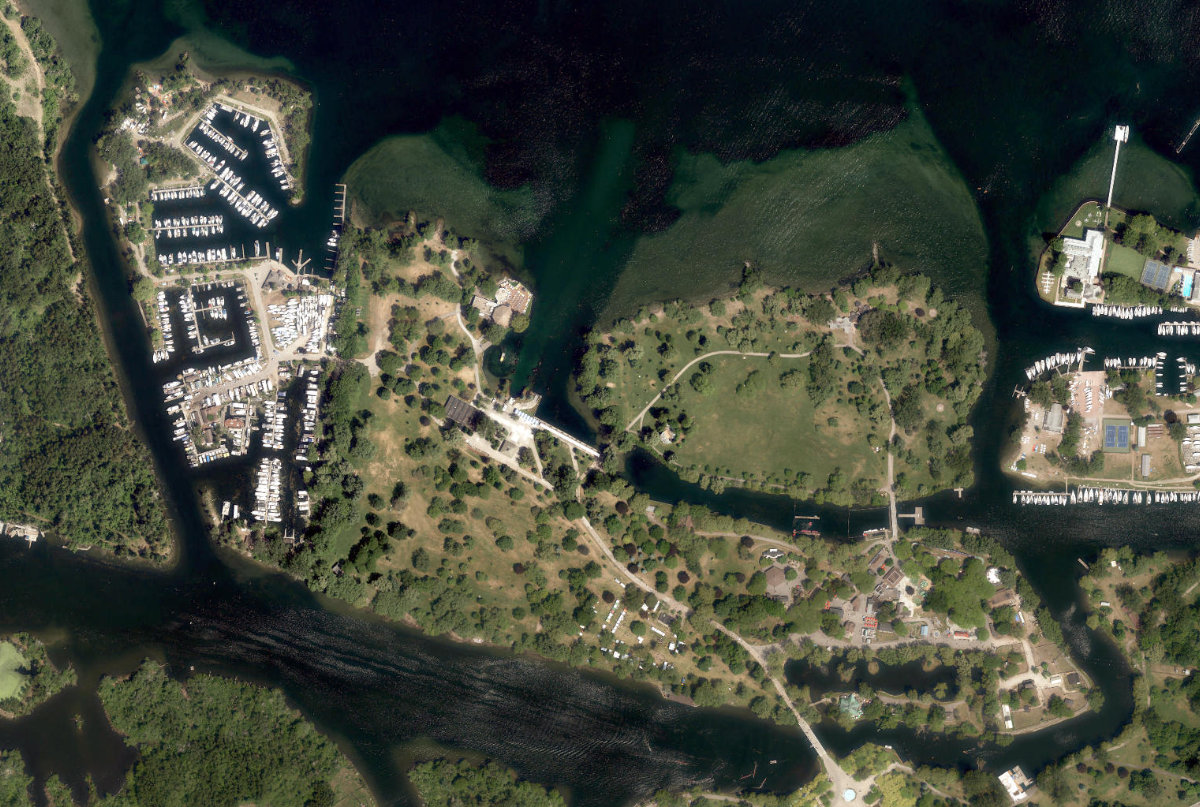
Explain this score
Where did the 52 come from? Each weighted contribution against a neutral 50 baseline. Green = pushed up; red = pulled down.
Sum of contributions = the headline score. A negative bar means that dimension dragged the park below the city-wide neutral baseline.
Why this park works
Toronto Islands - Island Park works because its edge activation score (71) is one of the city's strongest and its amenity diversity (28) is also top decile (its perimeter is lined with active uses).
What limits this park
Toronto Islands - Island Park is held back by enclosure (33, bottom quartile): no mid-rise frontage to provide eyes on the park.
Most distinctive characteristic
Most distinctive feature: exceptionally high edge activation (71, top decile).
Jacobs reading
Toronto Islands - Island Park sits between an urban social park and an ecological retreat: moderately useful for both, exceptionally suited to neither.
Performance in context
- This park is a strong overperformer for its cohort: raw 52 versus an expected 35 for similar parks (very large Waterfront Park waterfront) (gap +18).
Typology classification
Classified as Waterfront Park: 22% water surface inside park
Edge Activation
Within 100 m of the park edge: 15 active uses (restaurant, transit_stop, retail, cafe) and 0 dead/hostile uses (none). Active edges keep "eyes on the park" through the day; parking lots, blank institutional walls, rail and highway frontages drain street life.
Source: OSM POIs (amenity/shop) + Toronto Building Footprints + land use
Connectivity
Connectivity blends paths, intersections, transit, entrances, and edge density. This park has 61 mapped paths/walkways and 72 sidewalk segments within 50 m; 0 street intersections within 100 m; 1 transit stops within a 400 m walk; 11 estimated access points across ~4,000 m of perimeter. low edge density, significant superblock penalty applied. Source coverage: centreline, pedestrian_network, transit_osm.
Source: Toronto Centreline V2 + Pedestrian Network + OSM transit stops
Amenity Diversity
3 distinct amenity types in the park (picnic, playground, washroom). Diversity, not raw count, drives the score so a park with many distinct activity types can outrank a larger park that repeats the same use.
Source: Toronto Parks & Recreation Facilities + OSM amenity tags
Natural Comfort
Natural-comfort components for this park: 8.5% estimated tree canopy; 21.6% water surface; 18 city-mapped trees inside the polygon (0.6/ha). Reading: water-cooled. Source coverage: treed_area, waterbodies, street_trees. Impervious surface is approximated (Toronto's authoritative layer ships only as a raster GeoTIFF).
Source: Toronto Treed Area + Ravine + Waterbodies + Street Tree Inventory
Enclosure / Eyes on Park
48 buildings within 25 m of the park edge (0 mid-rise, 48 low-rise, 0 tower); avg edge height 3.5 m (~1 floors); 1.2 buildings per 100 m of 4,000 m perimeter (thin frontage with significant blank-edge share); edges are barely there or single-storey; no towers immediately adjacent. "Eyes on the park" come strongest from the 0 mid-rise edge buildings.
Source: Toronto 3D Massing (building footprints + heights)
Border Vacuum Risk
Park edges face the city. No significant border vacuum detected.
Source: Toronto Street Centreline (highways) + rail layer + OSM landuse + building footprints
Equity Context
Equity Context requires inputs not yet loaded for this park (Toronto Neighbourhood Profiles). Score is held at a neutral 50 with low confidence. Read with caution.
Source: Toronto Neighbourhood Profiles
Amenities (3 types · 3 records)
- picnic
- playground
- washroom
Nearby active-edge features (15)
- transit stop: Centre Island0 m
- restaurant: Pizza Pizza0 m
- restaurant: Subway0 m
- retail: Townhall Ticket Booth0 m
- restaurant: Cider Bar0 m
- restaurant: Subway0 m
- restaurant: Pizza Pizza0 m
- restaurant: Beavertails0 m
- cafe: Sister Sarah's Coffee Shop0 m
- retail: Lockers0 m
- retail0 m
- retail0 m
- retail: Dark Ride Ticket Booth0 m
- restaurant: Funnel Cake Shop0 m
- restaurant59 m
Park profile
Five-axis radar across the structural dimensions.
Citywide percentile ranks
Across all Toronto parks in the dataset.
- Overall vitality97th
- Edge activation99th
- Connectivity33th
- Amenity diversity94th
- Natural comfort63th
- Enclosure5th
Most similar parks
Closest in metric space across the five structural dimensions.
- Toronto Islands - Centre Island ParkWaterfront Park48
- Harbour Square Park LandsCivic Square49
- Toronto Islands - Olympic Island ParkWaterfront Park43
- Rowntree Mills ParkRavine / Naturalized Park43
- City Wide Open SpaceCorridor / Linear Park42
Most opposite parks
Furthest in metric space. Useful for recognising what kind of park this isn’t.
- High ParkRavine / Naturalized Park47
- Ramsden ParkRavine / Naturalized Park43
- Mount Pleasant CemeteryOther36
- Lawren Harris ParkRavine / Naturalized Park44
- Downsview ParkWaterfront Park30
Visitor signals
Public attention measured by Google Places aggregates. This proxies attention, not occupancy. Aggregate-only: no usernames, no review text, no extra photos beyond the cached hero.
“Scenic vistas of the Toronto skyline are a main attraction at this lush, grassy recreation area.” (Google editorial summary)
p91 citywide · p84 within Waterfront Park
Source: Google Places API · match unverified (0.00 composite confidence) · last refreshed 5/9/2026. Privacy contract. Measures public attention, not occupancy.
Human activity signals: not available
No activity signals have landed for this park yet. The model has scored its physical form but it can’t yet say how often it’s programmed, photographed, or walked through. See /data-ethics for what we will and will not collect.
Does this score feel accurate?
Your read of Toronto Islands - Island Parkmatters. We’re testing whether the model lines up with how people actually use the park. Submissions are stored locally; no account needed.
Tell us how this park feels
We measure structure (canopy, edges, connectivity). You measure feeling. Both matter, and disagreement is itself useful civic data.
What would improve this park?
Generated from the weakest measured dimensions: a starting point, not a prescription.
- Add or open more entrances and improve sidewalk continuity around the park. More permeability means more spontaneous use.
- Diversify what people can do in the park (playground, washroom, water, shade, performance, sport, garden): even small additions raise this score.
- Encourage mid-rise, windowed frontages around the park so residents have direct sightlines onto it.
Data sources
- City of Toronto Open Data: Parks (Green Space)Polygon boundaries, official names, types.
- Parks & Recreation FacilitiesInventory of in-park amenities (washrooms, fields, rinks…).
- Toronto Pedestrian NetworkSidewalk segments around and through parks; estimated park entrances.
- Toronto Centreline V2Street segments + intersection nodes near park edges; trails and walkways.
- Toronto 3D MassingBuilding footprints + heights for edge-building counts, frontage density, and tower-in-the-park risk.
- Toronto Treed AreaTree canopy share inside park polygons via stratified-grid sampling.
- Toronto Waterbodies & RiversWater surface inside parks + nearest-water distance for cooling.
- Ravine & Natural Feature ProtectionRavine overlap as a cooling / natural-comfort signal.
- Toronto Street Tree InventoryTree count + density inside park polygons.
- Neighbourhood Profiles(Pending) Equity context proxy.
- OpenStreetMap (Overpass API)Cafés, restaurants, retail, transit stops, parking, highways, rail.