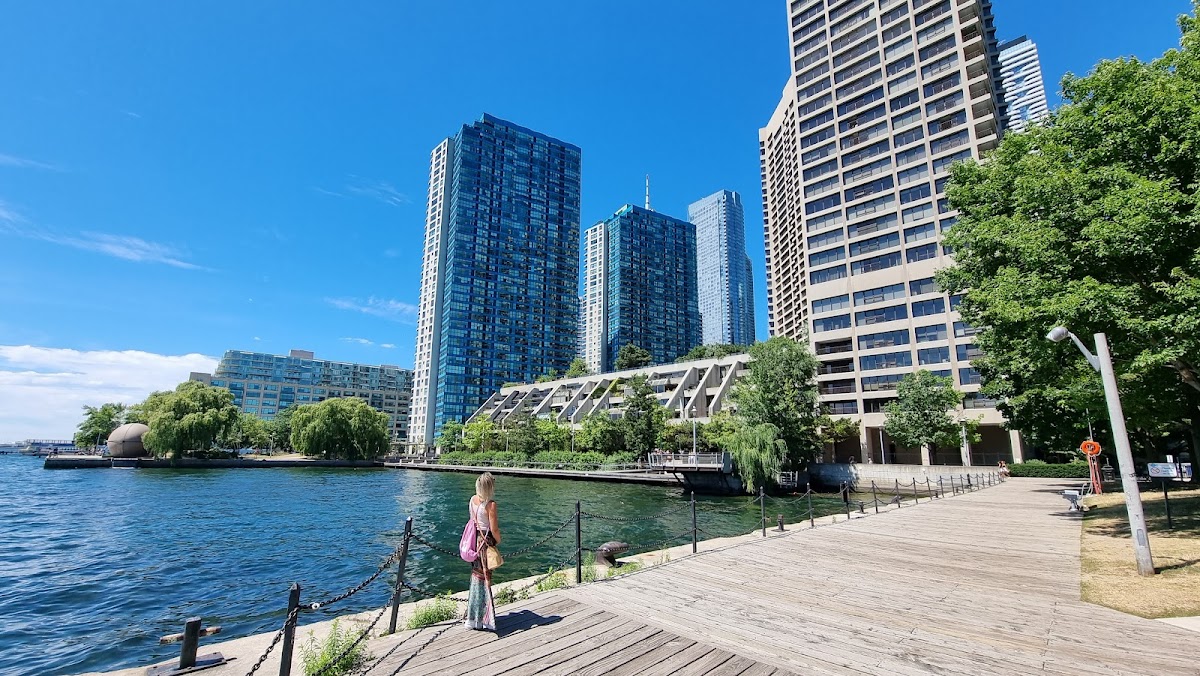
Harbour Square Park Lands
Civic Square, in the top tier overall (score 49, rank ~94th percentile). Strongest: edge activation; weakest: enclosure.
Photo by Roberto Valenti via Google Places · cached 5/9/2026
Harbour Square Park Lands scores 48.6 / 100. Strongest dimensions: edge activation and natural comfort. Weakest: amenity diversity (11.9). Border-vacuum risk is low. This score is a transparent reading of Jane Jacobs-style vitality factors, not a definitive judgment.
Area · 2.09 ha
Weighted across six dimensions · confidence 68%
Scores are not bell-curved. Percentiles and expected scores provide context without changing the underlying model.
Loading map…
The parks map is loading.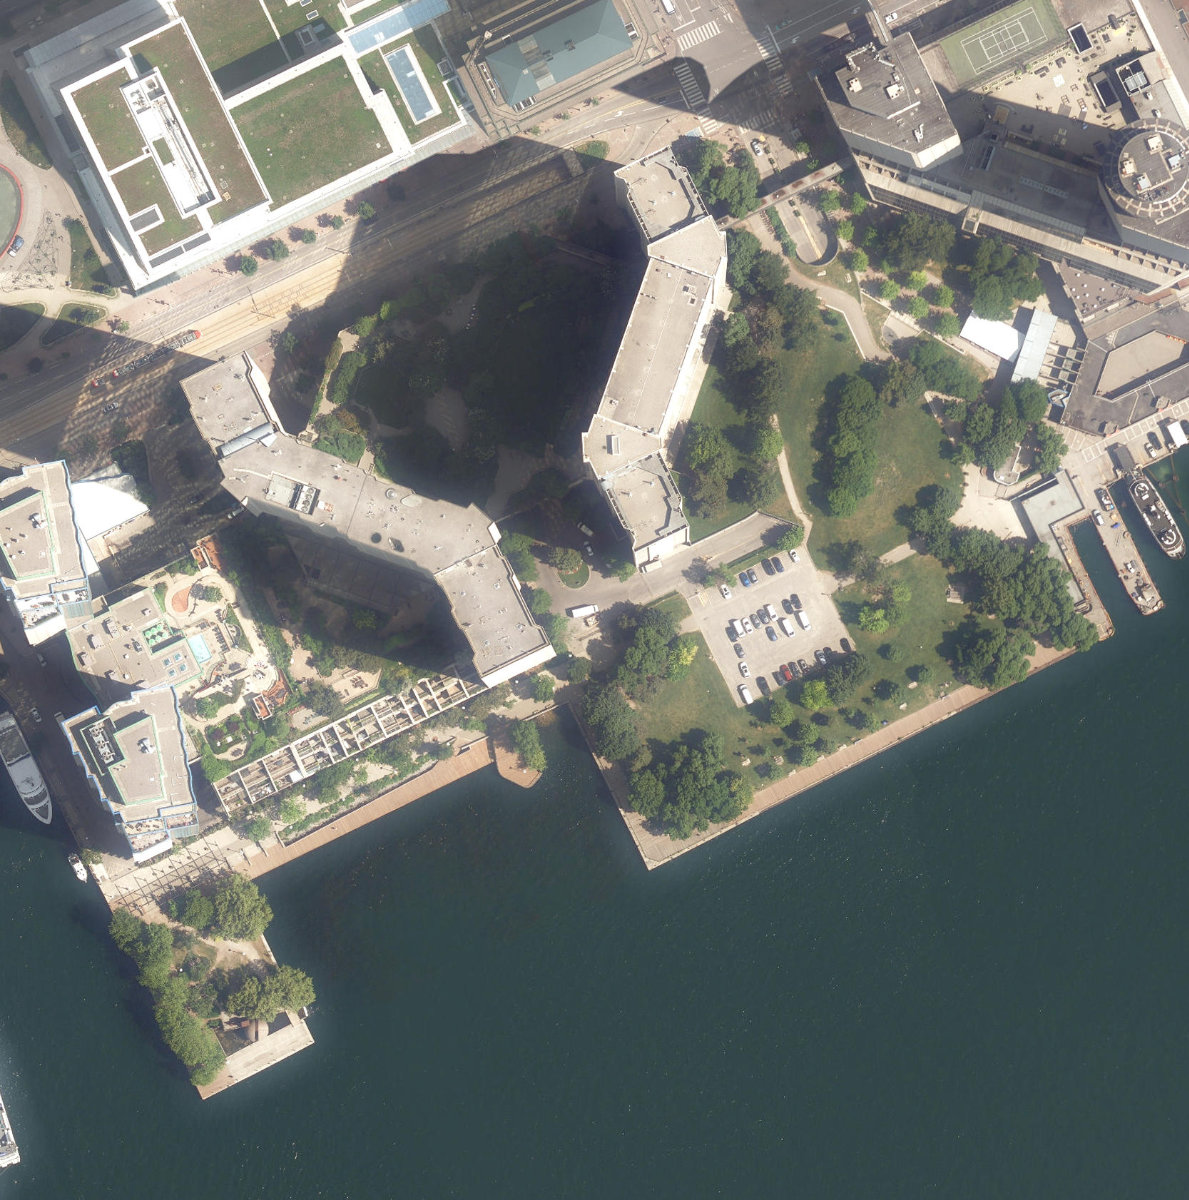
Explain this score
Where did the 49 come from? Each weighted contribution against a neutral 50 baseline. Green = pushed up; red = pulled down.
Sum of contributions = the headline score. A negative bar means that dimension dragged the park below the city-wide neutral baseline.
Why this park works
Harbour Square Park Lands works because its edge activation score (69) is one of the city's strongest and its amenity diversity (12) is also top quartile (its perimeter is lined with active uses).
What limits this park
Harbour Square Park Lands is held back by enclosure (39, bottom quartile).
Most distinctive characteristic
Most distinctive feature: exceptionally high edge activation (69, top decile).
Jacobs reading
Harbour Square Park Lands sits between an urban social park and an ecological retreat: moderately useful for both, exceptionally suited to neither.
Tradeoffs
- 10 nearby towers cast wind and shadow without contributing canopy: passive surveillance is plentiful but human-scale comfort is not.
Performance in context
- A modest overperformer for its civic square typology (+9 vs the median in medium Civic Square).
Typology classification
Classified as Civic Square: name flags as civic square + 26 buildings frame the edge. Secondary read: Waterfront Park (name suggests waterfront and nearest waterbody is ~31 m away).
Edge Activation
Within 100 m of the park edge: 34 active uses (cafe, restaurant, retail, transit_stop) and 2 dead/hostile uses (parking_lot). Active edges keep "eyes on the park" through the day; parking lots, blank institutional walls, rail and highway frontages drain street life.
Source: OSM POIs (amenity/shop) + Toronto Building Footprints + land use
Connectivity
Connectivity blends paths, intersections, transit, entrances, and edge density. This park has 2 mapped paths/walkways and 11 sidewalk segments within 50 m; 3 street intersections within 100 m; 21 transit stops within a 400 m walk; 0 estimated access points across ~1,409 m of perimeter. low edge density, significant superblock penalty applied. Source coverage: centreline, pedestrian_network, transit_osm.
Source: Toronto Centreline V2 + Pedestrian Network + OSM transit stops
Amenity Diversity
1 distinct amenity types in the park (washroom). Diversity, not raw count, drives the score so a park with many distinct activity types can outrank a larger park that repeats the same use.
Source: Toronto Parks & Recreation Facilities + OSM amenity tags
Natural Comfort
Natural-comfort components for this park: ~10.7% effective canopy (0.0% from contiguous tree polygons + scattered tree density); nearest waterbody ~31 m; 32 city-mapped trees inside the polygon (15.3/ha). Reading: water-cooled. Source coverage: waterbodies, street_trees. Impervious surface is approximated (Toronto's authoritative layer ships only as a raster GeoTIFF).
Source: Toronto Treed Area + Ravine + Waterbodies + Street Tree Inventory
Enclosure / Eyes on Park
26 buildings within 25 m of the park edge (10 mid-rise, 6 low-rise, 10 tower); avg edge height 41.3 m (~14 floors); 1.8 buildings per 100 m of 1,409 m perimeter (moderate frontage density); edges dominated by towers; 10 towers ≥ 40 m within 25 m of the edge. "Eyes on the park" come strongest from the 10 mid-rise edge buildings.
Source: Toronto 3D Massing (building footprints + heights)
Border Vacuum Risk
Border-vacuum factors within 50 m of the park: parking_lot. Jacobs warned that highways, rail, parking lots and blank institutional edges act as "vacuums" that suppress foot traffic and isolate the park from its neighbourhood.
Source: Toronto Street Centreline (highways) + rail layer + OSM landuse + building footprints
Equity Context
Equity Context requires inputs not yet loaded for this park (Toronto Neighbourhood Profiles). Score is held at a neutral 50 with low confidence. Read with caution.
Source: Toronto Neighbourhood Profiles
Amenities (1 types · 1 records)
- washroom
Nearby active-edge features (80)
- restaurant: Chartroom19 m
- restaurant: Stefra’s Snack Bar20 m
- parking lot21 m
- transit stop: Jack Layton Ferry Terminal23 m
- restaurant: Don Alfonso 189038 m
- transit stop: Queens Quay - Ferry Docks39 m
- transit stop: Jack Layton Ferry Terminal40 m
- transit stop: Queens Quay - Island Ferry Docks41 m
- restaurant: Mizzen - Westin Harbour Castle52 m
- transit stop: Jack Layton Ferry Terminal53 m
- restaurant: Miku58 m
- transit stop: Queens Quay - Ferry Docks61 m
- restaurant: Miku64 m
- transit stop: Queens Quay - Island Ferry Docks64 m
- parking lot75 m
- transit stop75 m
- cafe: Tim Hortons76 m
- transit stop77 m
- restaurant: Booster Juice81 m
- restaurant: My Roti Place / My Dosa Place81 m
- transit stop: Harbour Street87 m
- restaurant: Piazza Manna Restaurant & Bar88 m
- transit stop88 m
- cafe: Tim Hortons88 m
- retail: Prayosha Threading & Wax Bar91 m
- retail: INS Market91 m
- cafe: Mos Mos91 m
- restaurant: Szechuan Express93 m
- retail: Preeners Cleaners94 m
- retail: City Cruises by Hornblower97 m
- restaurant: Villa Madina97 m
- cafe: Aroma Espresso Bar97 m
- transit stop: Queens Quay W at Bay St97 m
- restaurant: Alexandros98 m
- restaurant: The Goodman Pub and Kitchen98 m
- restaurant: piazza manna100 m
- cafe: Tim Hortons101 m
- restaurant: Subway103 m
- restaurant: Church's Chicken104 m
- retail: Nav’s Grocery105 m
- restaurant: freshwest grill106 m
- retail: Wine Rack108 m
- retail: Harbour Tours109 m
- restaurant: Oyshi Sushi109 m
- restaurant: Fast Fresh109 m
- restaurant: Shanghai 360110 m
- retail: I Love Churros111 m
- restaurant: Kupfert & Kim112 m
- restaurant: BeaverTails113 m
- retail: One East Hair Salon114 m
- retail: Vape 89 Shop114 m
- restaurant: A&W114 m
- cafe: Ivy Coffee Shop115 m
- retail: Farm Boy116 m
- restaurant: Jimmy the Greek118 m
- retail: Kitchen Table121 m
- retail: Boat Tour Tickets & Information122 m
- restaurant: Joe Bird125 m
- cafe: Starbucks125 m
- restaurant: Casa 73125 m
- cafe: The Fix127 m
- restaurant: Mr Souvlaki128 m
- restaurant: Edo Japan131 m
- restaurant: Pearl Harbourfront Chinese132 m
- highway: Harbour Street136 m
- restaurant: Pie Bar139 m
- highway: Harbour Street139 m
- retail: Maverick Studio for Men147 m
- restaurant: Miller Tavern156 m
- highway: Harbour Street159 m
- parking lot159 m
- retail: Fashion Cleaners162 m
- retail: Harbourfront Cannabis168 m
- restaurant: Harbour Sixty Steakhouse170 m
- parking lot175 m
- restaurant: Firkin on Harbour177 m
- restaurant: Butcher Chef179 m
- parking lot182 m
- cafe: Starbucks184 m
- restaurant: The Fox189 m
Park profile
Five-axis radar across the structural dimensions.
Citywide percentile ranks
Across all Toronto parks in the dataset.
- Overall vitality94th
- Edge activation99th
- Connectivity47th
- Amenity diversity76th
- Natural comfort54th
- Enclosure8th
Most similar parks
Closest in metric space across the five structural dimensions.
- Toronto Islands - Island ParkWaterfront Park52
- David Pecaut SquareCivic Square48
- City Wide Open SpaceCorridor / Linear Park42
- Toronto Waterfront ParkWaterfront Park43
- Rowntree Mills ParkRavine / Naturalized Park43
Most opposite parks
Furthest in metric space. Useful for recognising what kind of park this isn’t.
- High ParkRavine / Naturalized Park47
- Ramsden ParkRavine / Naturalized Park43
- Withrow ParkNeighbourhood Park50
- Lower Don ParklandsRavine / Naturalized Park33
- Lawren Harris ParkRavine / Naturalized Park44
Visitor signals
Public attention measured by Google Places aggregates. This proxies attention, not occupancy. Aggregate-only: no usernames, no review text, no extra photos beyond the cached hero.
“Grassy park with benches, shade trees, an oversize picnic table & a waterfront boardwalk.” (Google editorial summary)
p99 citywide · p93 within Civic Square
Source: Google Places API · match high (0.87 composite confidence) · last refreshed 5/9/2026. Privacy contract. Measures public attention, not occupancy.
Human activity signals: not available
No activity signals have landed for this park yet. The model has scored its physical form but it can’t yet say how often it’s programmed, photographed, or walked through. See /data-ethics for what we will and will not collect.
Does this score feel accurate?
Your read of Harbour Square Park Landsmatters. We’re testing whether the model lines up with how people actually use the park. Submissions are stored locally; no account needed.
Tell us how this park feels
We measure structure (canopy, edges, connectivity). You measure feeling. Both matter, and disagreement is itself useful civic data.
What would improve this park?
Generated from the weakest measured dimensions: a starting point, not a prescription.
- Add or open more entrances and improve sidewalk continuity around the park. More permeability means more spontaneous use.
- Diversify what people can do in the park (playground, washroom, water, shade, performance, sport, garden): even small additions raise this score.
- Increase canopy and reduce paved area. Shade and water features extend usable hours and seasons.
- Encourage mid-rise, windowed frontages around the park so residents have direct sightlines onto it.
Data sources
- City of Toronto Open Data: Parks (Green Space)Polygon boundaries, official names, types.
- Parks & Recreation FacilitiesInventory of in-park amenities (washrooms, fields, rinks…).
- Toronto Pedestrian NetworkSidewalk segments around and through parks; estimated park entrances.
- Toronto Centreline V2Street segments + intersection nodes near park edges; trails and walkways.
- Toronto 3D MassingBuilding footprints + heights for edge-building counts, frontage density, and tower-in-the-park risk.
- Toronto Treed AreaTree canopy share inside park polygons via stratified-grid sampling.
- Toronto Waterbodies & RiversWater surface inside parks + nearest-water distance for cooling.
- Ravine & Natural Feature ProtectionRavine overlap as a cooling / natural-comfort signal.
- Toronto Street Tree InventoryTree count + density inside park polygons.
- Neighbourhood Profiles(Pending) Equity context proxy.
- OpenStreetMap (Overpass API)Cafés, restaurants, retail, transit stops, parking, highways, rail.