Mount Pleasant Cemetery
Other, middle of the pack overall (score 36, rank ~59th percentile). Strongest: connectivity; weakest: edge activation.
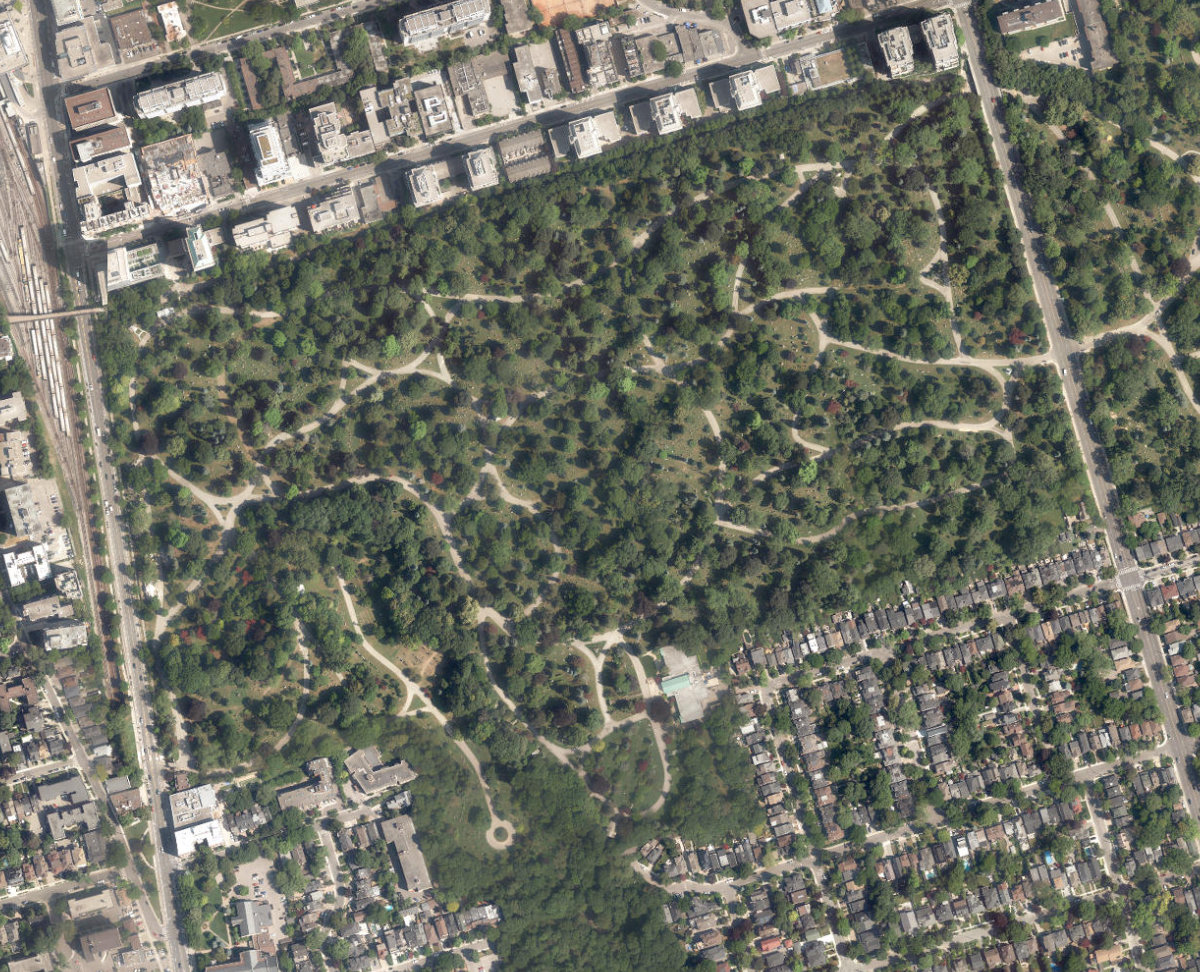
Aerial, City of Toronto orthophoto, ~8 cm/px source · cached 5/9/2026
Mount Pleasant Cemetery scores 36.1 / 100. Strongest dimensions: enclosure / eyes on park and natural comfort. Weakest: amenity diversity (0). Border-vacuum risk is elevated (100). This score is a transparent reading of Jane Jacobs-style vitality factors, not a definitive judgment.
Area · 38.36 ha
Weighted across six dimensions · confidence 63%
Scores are not bell-curved. Percentiles and expected scores provide context without changing the underlying model.
Loading map…
The parks map is loading.Explain this score
Where did the 36 come from? Each weighted contribution against a neutral 50 baseline. Green = pushed up; red = pulled down.
Sum of contributions = the headline score. A negative bar means that dimension dragged the park below the city-wide neutral baseline.
Why this park works
Mount Pleasant Cemetery works because its connectivity score (76) is one of the city's strongest and its enclosure (89) is also top decile (61 transit stops sit within a 400 m walk; 35 intersections fall within 100 m of the edge).
What limits this park
Mount Pleasant Cemetery is held back by edge activation (0, bottom quartile): the surrounding streets carry too few active uses to spill into the park; border-vacuum risk is also elevated (100).
Most distinctive characteristic
Most distinctive feature: exceptionally high connectivity (76, top decile).
Jacobs reading
Mount Pleasant Cemetery sits between an urban social park and an ecological retreat: moderately useful for both, exceptionally suited to neither.
Tradeoffs
- The park is enclosed by buildings (89) but the surrounding streets are quiet (edge activation 0): frame without animation.
- High connectivity coexists with high border-vacuum risk (100): much of that connectivity is to highways, rail, or parking lots, not to neighbourhoods.
Performance in context
- A modest overperformer for its other typology (+10 vs the median in Other).
- Although its citywide rank is low (59th), it ranks highly among similar others (86th): strong for what it is, even if the absolute score is moderate.
Typology classification
Classified as Other: does not meet any specific typology threshold (38.4 ha, 0 amenity types, frontage 11.1/100m)
Edge Activation
Within 100 m of the park edge: 16 active uses (transit_stop, cafe, retail, restaurant) and 22 dead/hostile uses (rail, highway, parking_lot). Active edges keep "eyes on the park" through the day; parking lots, blank institutional walls, rail and highway frontages drain street life.
Source: OSM POIs (amenity/shop) + Toronto Building Footprints + land use
Connectivity
Connectivity blends paths, intersections, transit, entrances, and edge density. This park has 18 mapped paths/walkways and 49 sidewalk segments within 50 m; 35 street intersections within 100 m; 61 transit stops within a 400 m walk; 10 estimated access points across ~2,832 m of perimeter. moderate edge density, small superblock penalty applied. Source coverage: centreline, pedestrian_network, transit_osm.
Source: Toronto Centreline V2 + Pedestrian Network + OSM transit stops
Amenity Diversity
No amenities recorded. Score is 0 until inventory is loaded.
Source: Toronto Parks & Recreation Facilities + OSM amenity tags
Natural Comfort
Natural-comfort components for this park: 53.2% estimated tree canopy; 16.6% inside the ravine system; nearest waterbody ~356 m; 16 city-mapped trees inside the polygon (0.4/ha). Reading: well-shaded. Source coverage: treed_area, ravine, waterbodies, street_trees. Impervious surface is approximated (Toronto's authoritative layer ships only as a raster GeoTIFF).
Source: Toronto Treed Area + Ravine + Waterbodies + Street Tree Inventory
Enclosure / Eyes on Park
313 buildings within 25 m of the park edge (124 mid-rise, 183 low-rise, 6 tower); avg edge height 12.6 m (~4 floors); 11.1 buildings per 100 m of 2,832 m perimeter (strong frontage density); edges are at a Jacobs-scale walkable mid-rise (3 to 7 floors); 6 towers ≥ 40 m within 25 m of the edge. "Eyes on the park" come strongest from the 124 mid-rise edge buildings.
Source: Toronto 3D Massing (building footprints + heights)
Border Vacuum Risk
Border-vacuum factors within 50 m of the park: rail, Yonge Street, Yonge-University-Spadina Line, parking_lot, parking_lot, Yonge Street. Jacobs warned that highways, rail, parking lots and blank institutional edges act as "vacuums" that suppress foot traffic and isolate the park from its neighbourhood.
Source: Toronto Street Centreline (highways) + rail layer + OSM landuse + building footprints
Equity Context
Equity Context requires inputs not yet loaded for this park (Toronto Neighbourhood Profiles). Score is held at a neutral 50 with low confidence. Read with caution.
Source: Toronto Neighbourhood Profiles
Amenities (0)
No amenities recorded for this park.
Nearby active-edge features (80)
- transit stop: Mount Pleasant Cemetery4 m
- highway: Yonge Street13 m
- highway: Yonge Street13 m
- transit stop: Mount Pleasant Cemetery20 m
- rail: Yonge-University-Spadina Line37 m
- parking lot38 m
- parking lot42 m
- retail: Sketchley Cleaners46 m
- rail47 m
- rail51 m
- highway: Yonge Street51 m
- retail: Siinardi Hair Design56 m
- rail61 m
- parking lot64 m
- transit stop: Merton Street67 m
- transit stop: Moore Avenue68 m
- parking lot68 m
- parking lot69 m
- parking lot73 m
- parking lot74 m
- rail75 m
- retail: Merton Nails76 m
- restaurant: Red Lantern77 m
- restaurant: Chacho's78 m
- retail: Bosley Real Estate78 m
- transit stop: Moore Avenue80 m
- parking lot: Chacho's Restaurant customer parking83 m
- cafe: Yonge/Merton84 m
- parking lot86 m
- restaurant: Jeff’s Kitchen87 m
- retail: Sketchley Cleaners88 m
- rail89 m
- transit stop: Merton Street90 m
- rail90 m
- highway: Yonge Street90 m
- transit stop: Merton Street91 m
- highway: Yonge Street95 m
- parking lot99 m
- rail102 m
- rail103 m
- parking lot104 m
- transit stop: Merton Street105 m
- parking lot105 m
- parking lot: 250 Merton Street Private Parking106 m
- parking lot107 m
- rail110 m
- parking lot111 m
- parking lot111 m
- parking lot112 m
- parking lot115 m
- rail116 m
- parking lot116 m
- rail116 m
- parking lot117 m
- parking lot118 m
- parking lot119 m
- restaurant: The Bull a Firkin Pub121 m
- parking lot122 m
- parking lot122 m
- parking lot123 m
- rail124 m
- parking lot124 m
- parking lot130 m
- parking lot132 m
- rail133 m
- parking lot133 m
- restaurant: Tamasha133 m
- rail135 m
- rail140 m
- parking lot141 m
- parking lot143 m
- parking lot148 m
- parking lot149 m
- highway: Yonge Street150 m
- highway: Yonge Street156 m
- cafe: Tim Hortons156 m
- rail157 m
- parking lot158 m
- retail: Circle K161 m
- transit stop: Heath Street164 m
Park profile
Five-axis radar across the structural dimensions.
Citywide percentile ranks
Across all Toronto parks in the dataset.
- Overall vitality59th
- Edge activation11th
- Connectivity96th
- Amenity diversity16th
- Natural comfort91th
- Enclosure95th
Most similar parks
Closest in metric space across the five structural dimensions.
- Rosedale Ravine LandsRavine / Naturalized Park37
- Lawren Harris ParkRavine / Naturalized Park44
- Kempford ParketteCorridor / Linear Park45
- Cedarvale RavineRavine / Naturalized Park40
- Todmorden Mills ParkRavine / Naturalized Park34
Most opposite parks
Furthest in metric space. Useful for recognising what kind of park this isn’t.
- Rouge ParkRavine / Naturalized Park18
- Queen'S Quay Traffic IslandWaterfront Park49
- Trca Lands ( 58)Waterfront Park18
- Danforth Gardens ParkParkette42
- Rouge ParkRavine / Naturalized Park21
Human activity signals: not available
No activity signals have landed for this park yet. The model has scored its physical form but it can’t yet say how often it’s programmed, photographed, or walked through. See /data-ethics for what we will and will not collect.
Does this score feel accurate?
Your read of Mount Pleasant Cemeterymatters. We’re testing whether the model lines up with how people actually use the park. Submissions are stored locally; no account needed.
Tell us how this park feels
We measure structure (canopy, edges, connectivity). You measure feeling. Both matter, and disagreement is itself useful civic data.
What would improve this park?
Generated from the weakest measured dimensions: a starting point, not a prescription.
- Activate the edges: encourage cafés, retail or community uses on the streets that face the park; replace blank or parking-lot edges where possible.
- Diversify what people can do in the park (playground, washroom, water, shade, performance, sport, garden): even small additions raise this score.
- Mitigate border vacuums (highways, rail, parking) with active programming on the still-permeable edges and treat the hostile edge as a design challenge.
Data sources
- City of Toronto Open Data: Parks (Green Space)Polygon boundaries, official names, types.
- Parks & Recreation FacilitiesInventory of in-park amenities (washrooms, fields, rinks…).
- Toronto Pedestrian NetworkSidewalk segments around and through parks; estimated park entrances.
- Toronto Centreline V2Street segments + intersection nodes near park edges; trails and walkways.
- Toronto 3D MassingBuilding footprints + heights for edge-building counts, frontage density, and tower-in-the-park risk.
- Toronto Treed AreaTree canopy share inside park polygons via stratified-grid sampling.
- Toronto Waterbodies & RiversWater surface inside parks + nearest-water distance for cooling.
- Ravine & Natural Feature ProtectionRavine overlap as a cooling / natural-comfort signal.
- Toronto Street Tree InventoryTree count + density inside park polygons.
- Neighbourhood Profiles(Pending) Equity context proxy.
- OpenStreetMap (Overpass API)Cafés, restaurants, retail, transit stops, parking, highways, rail.