Tam O'Shanter Golf Course
Ravine / Naturalized Park, middle of the pack overall (score 33, rank ~45th percentile). Strongest: connectivity; weakest: amenity diversity.
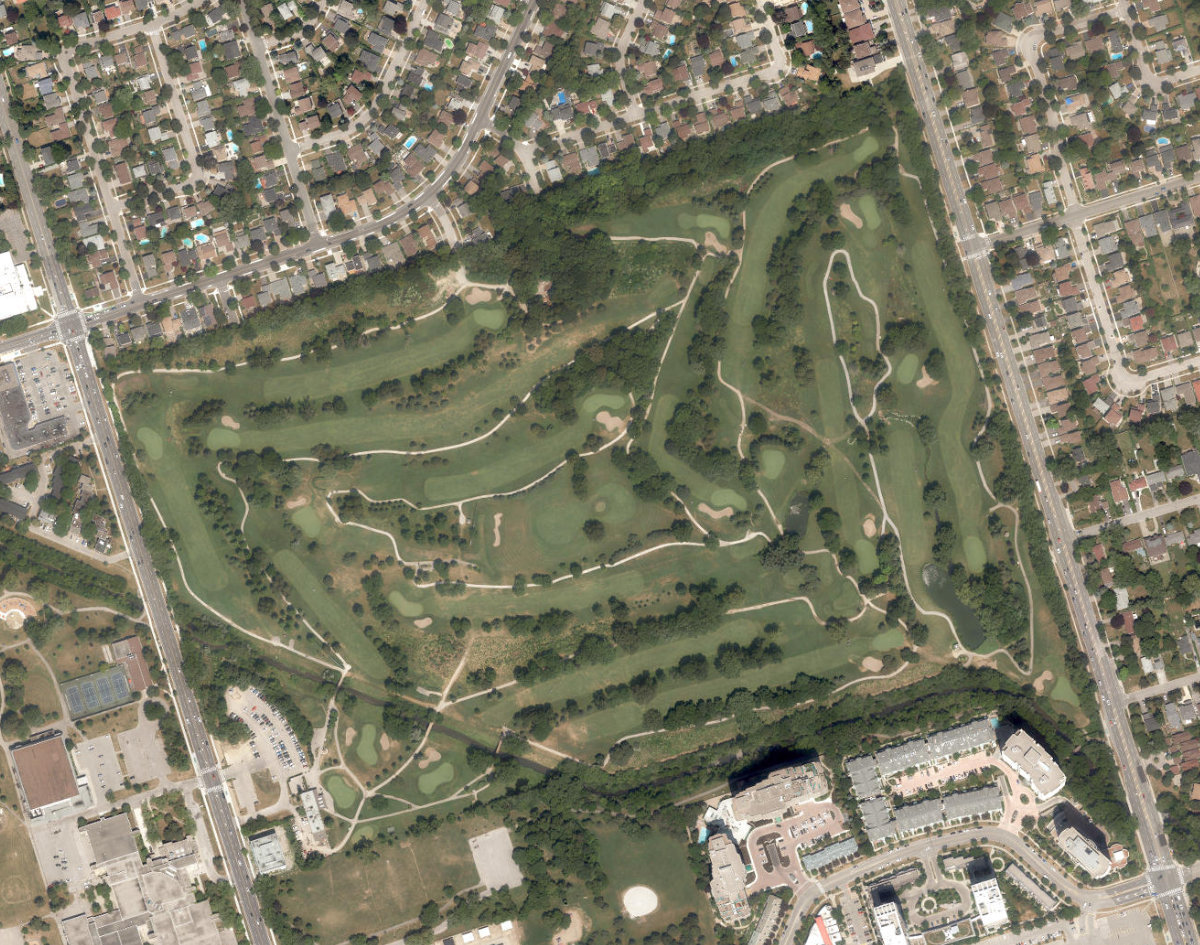
Aerial, City of Toronto orthophoto, ~8 cm/px source · cached 5/9/2026
Tam O'Shanter Golf Course scores 33.1 / 100. Strongest dimensions: connectivity and enclosure / eyes on park. Weakest: amenity diversity (0). Border-vacuum risk is elevated (60). This score is a transparent reading of Jane Jacobs-style vitality factors, not a definitive judgment.
Area · 42.38 ha
Weighted across six dimensions · confidence 63%
Scores are not bell-curved. Percentiles and expected scores provide context without changing the underlying model.
Loading map…
The parks map is loading.Explain this score
Where did the 33 come from? Each weighted contribution against a neutral 50 baseline. Green = pushed up; red = pulled down.
Sum of contributions = the headline score. A negative bar means that dimension dragged the park below the city-wide neutral baseline.
Why this park works
Tam O'Shanter Golf Course works because its connectivity score (69) is in the top tier and its edge activation (7) is also above-average (31 transit stops sit within a 400 m walk; 19 intersections fall within 100 m of the edge).
What limits this park
Tam O'Shanter Golf Course's edges are fronted by border-vacuum land uses (highways, rail, parking, blank institutional), risk score 60.
Most distinctive characteristic
Most distinctive feature: exceptionally high connectivity (69, top quartile).
Jacobs reading
Tam O'Shanter Golf Course sits between an urban social park and an ecological retreat: moderately useful for both, exceptionally suited to neither.
Tradeoffs
- The park is enclosed by buildings (66) but the surrounding streets are quiet (edge activation 7): frame without animation.
- 7 nearby towers cast wind and shadow without contributing canopy: passive surveillance is plentiful but human-scale comfort is not.
- High connectivity coexists with high border-vacuum risk (60): much of that connectivity is to highways, rail, or parking lots, not to neighbourhoods.
Typology classification
Classified as Ravine / Naturalized Park: 100% ravine overlap, 3% canopy. Secondary read: Waterfront Park (nearest waterbody within ~0 m).
Edge Activation
Within 100 m of the park edge: 23 active uses (retail, restaurant, transit_stop, cafe) and 9 dead/hostile uses (parking_lot). Active edges keep "eyes on the park" through the day; parking lots, blank institutional walls, rail and highway frontages drain street life.
Source: OSM POIs (amenity/shop) + Toronto Building Footprints + land use
Connectivity
Connectivity blends paths, intersections, transit, entrances, and edge density. This park has 5 mapped paths/walkways and 48 sidewalk segments within 50 m; 19 street intersections within 100 m; 31 transit stops within a 400 m walk; 3 estimated access points across ~2,823 m of perimeter. low edge density, significant superblock penalty applied. Source coverage: centreline, pedestrian_network, transit_osm.
Source: Toronto Centreline V2 + Pedestrian Network + OSM transit stops
Amenity Diversity
No amenities recorded. Score is 0 until inventory is loaded.
Source: Toronto Parks & Recreation Facilities + OSM amenity tags
Natural Comfort
Natural-comfort components for this park: 3.4% estimated tree canopy; 100.0% inside the ravine system; 1.3% water surface; 192 city-mapped trees inside the polygon (4.5/ha). Reading: ravine-cooled. Source coverage: treed_area, ravine, waterbodies, street_trees. Impervious surface is approximated (Toronto's authoritative layer ships only as a raster GeoTIFF).
Source: Toronto Treed Area + Ravine + Waterbodies + Street Tree Inventory
Enclosure / Eyes on Park
163 buildings within 25 m of the park edge (6 mid-rise, 150 low-rise, 7 tower); avg edge height 8.1 m (~3 floors); 5.8 buildings per 100 m of 2,823 m perimeter (strong frontage density); edges are low-rise (mostly 2 to 3 floors); 7 towers ≥ 40 m within 25 m of the edge. "Eyes on the park" come strongest from the 6 mid-rise edge buildings.
Source: Toronto 3D Massing (building footprints + heights)
Border Vacuum Risk
Border-vacuum factors within 50 m of the park: parking_lot, parking_lot, parking_lot, parking_lot, parking_lot. Jacobs warned that highways, rail, parking lots and blank institutional edges act as "vacuums" that suppress foot traffic and isolate the park from its neighbourhood.
Source: Toronto Street Centreline (highways) + rail layer + OSM landuse + building footprints
Equity Context
Equity Context requires inputs not yet loaded for this park (Toronto Neighbourhood Profiles). Score is held at a neutral 50 with low confidence. Read with caution.
Source: Toronto Neighbourhood Profiles
Amenities (0)
No amenities recorded for this park.
Nearby active-edge features (49)
- parking lot0 m
- parking lot0 m
- transit stop: 2481 Birchmount Road1 m
- transit stop: Havendale Road9 m
- transit stop: Reidmount Avenue10 m
- transit stop: Marilyn Avenue13 m
- transit stop: 2450 Birchmount Road (Stephen Leacock Collegiate)25 m
- transit stop: Kennedy Rd at Reidmount Ave31 m
- transit stop: Marilyn Avenue32 m
- parking lot35 m
- transit stop: Havendale Road36 m
- transit stop: Harfleur Road40 m
- restaurant: Chris Jerk48 m
- parking lot49 m
- parking lot49 m
- restaurant: Bong Lua57 m
- transit stop: Harfleur Road58 m
- transit stop: Huntingwood Drive at Birchmount Road59 m
- parking lot67 m
- restaurant: Hunter's Pizza & Souvlaki House67 m
- transit stop68 m
- transit stop: Birchmount Road at Huntingwood Drive North Side73 m
- parking lot74 m
- parking lot77 m
- transit stop: Birchmount Road at Huntingwood Drive77 m
- transit stop: Huntingwood Drive at Birchmount Road80 m
- restaurant: Mexico Lindo80 m
- restaurant: Fortune House Restaurant81 m
- cafe: Tim Hortons85 m
- retail: Daisy Mart88 m
- parking lot89 m
- transit stop: Linwood Avenue95 m
- transit stop: Linwood Avenue100 m
- school: Gateway Montessori School102 m
- parking lot104 m
- parking lot106 m
- parking lot109 m
- parking lot110 m
- transit stop: Fluellen Drive127 m
- parking lot136 m
- parking lot141 m
- community: Stephen Leacock Community Centre145 m
- community147 m
- parking lot168 m
- transit stop: Cardwell Avenue171 m
- transit stop: Bonis Avenue177 m
- parking lot187 m
- parking lot196 m
- parking lot196 m
Park profile
Five-axis radar across the structural dimensions.
Citywide percentile ranks
Across all Toronto parks in the dataset.
- Overall vitality45th
- Edge activation67th
- Connectivity89th
- Amenity diversity45th
- Natural comfort52th
- Enclosure59th
Most similar parks
Closest in metric space across the five structural dimensions.
- Toronto Hydro Green SpaceCorridor / Linear Park29
- Regent Park - EtobicokeParkette34
- West Highland Creek WatercourseWaterfront Park34
- York StadiumNeighbourhood Park33
- Ambrose ParketteParkette38
Most opposite parks
Furthest in metric space. Useful for recognising what kind of park this isn’t.
- Trca Lands ( 26)Ravine / Naturalized Park27
- Kew GardensNeighbourhood Park71
- Joseph Burr Tyrrell ParkUrban Plaza50
- Leslie Grove ParkParkette68
- Toronto Islands - Muggs Island ParkRavine / Naturalized Park25
Human activity signals: not available
No activity signals have landed for this park yet. The model has scored its physical form but it can’t yet say how often it’s programmed, photographed, or walked through. See /data-ethics for what we will and will not collect.
Does this score feel accurate?
Your read of Tam O'Shanter Golf Coursematters. We’re testing whether the model lines up with how people actually use the park. Submissions are stored locally; no account needed.
Tell us how this park feels
We measure structure (canopy, edges, connectivity). You measure feeling. Both matter, and disagreement is itself useful civic data.
What would improve this park?
Generated from the weakest measured dimensions: a starting point, not a prescription.
- Activate the edges: encourage cafés, retail or community uses on the streets that face the park; replace blank or parking-lot edges where possible.
- Diversify what people can do in the park (playground, washroom, water, shade, performance, sport, garden): even small additions raise this score.
- Increase canopy and reduce paved area. Shade and water features extend usable hours and seasons.
- Mitigate border vacuums (highways, rail, parking) with active programming on the still-permeable edges and treat the hostile edge as a design challenge.
Data sources
- City of Toronto Open Data: Parks (Green Space)Polygon boundaries, official names, types.
- Parks & Recreation FacilitiesInventory of in-park amenities (washrooms, fields, rinks…).
- Toronto Pedestrian NetworkSidewalk segments around and through parks; estimated park entrances.
- Toronto Centreline V2Street segments + intersection nodes near park edges; trails and walkways.
- Toronto 3D MassingBuilding footprints + heights for edge-building counts, frontage density, and tower-in-the-park risk.
- Toronto Treed AreaTree canopy share inside park polygons via stratified-grid sampling.
- Toronto Waterbodies & RiversWater surface inside parks + nearest-water distance for cooling.
- Ravine & Natural Feature ProtectionRavine overlap as a cooling / natural-comfort signal.
- Toronto Street Tree InventoryTree count + density inside park polygons.
- Neighbourhood Profiles(Pending) Equity context proxy.
- OpenStreetMap (Overpass API)Cafés, restaurants, retail, transit stops, parking, highways, rail.