Albert Campbell Square
Civic Square, near the bottom of the city overall (score 25, rank ~11th percentile). Strongest: edge activation; weakest: natural comfort.
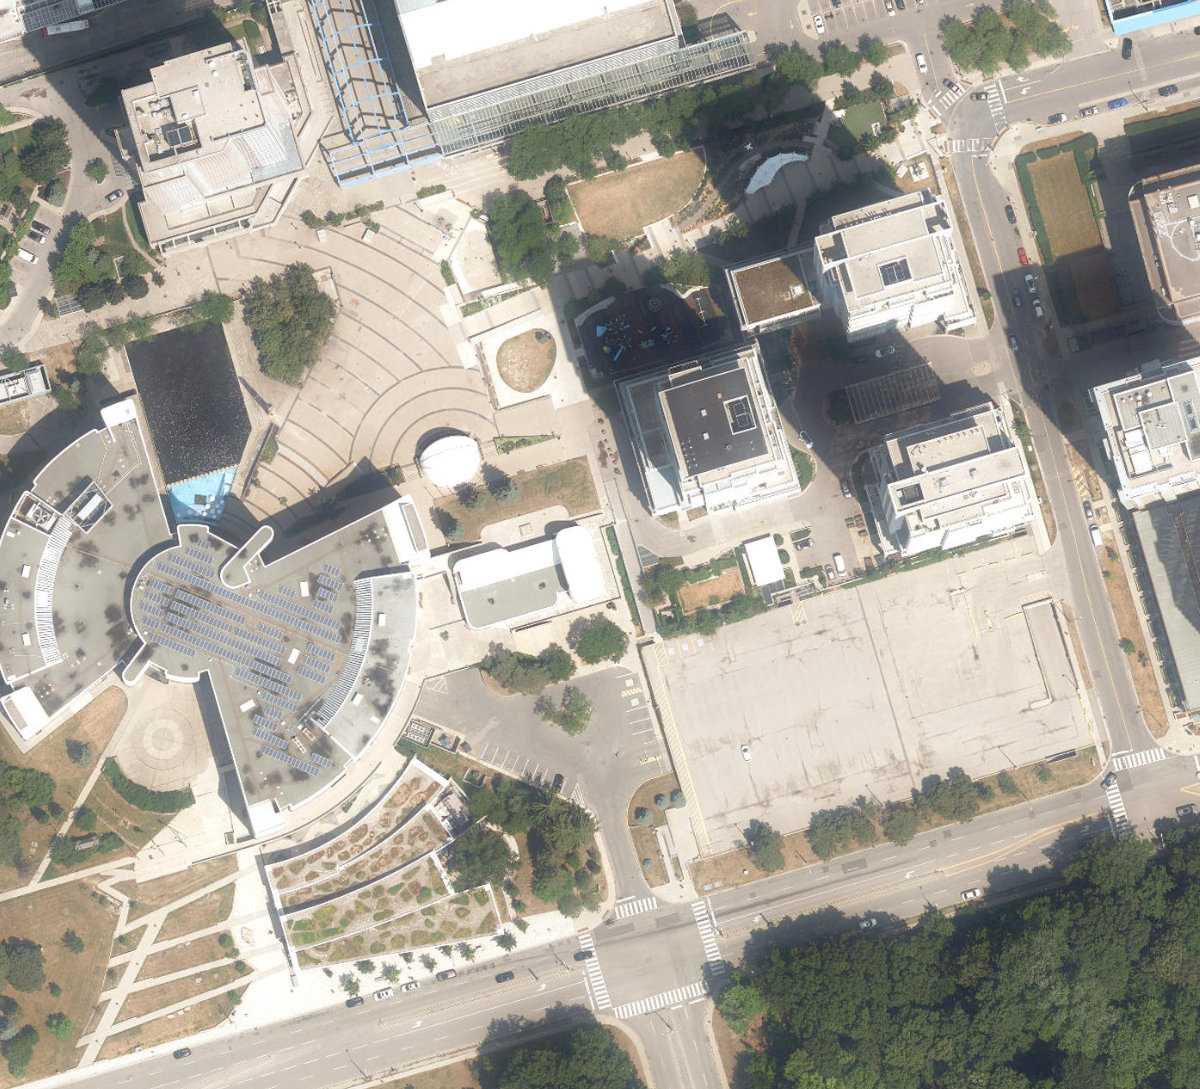
Aerial, City of Toronto orthophoto, ~8 cm/px source · cached 5/9/2026
Albert Campbell Square scores 24.5 / 100. Strongest dimensions: enclosure / eyes on park and connectivity. Weakest: amenity diversity (0). Border-vacuum risk is elevated (84). This score is a transparent reading of Jane Jacobs-style vitality factors, not a definitive judgment.
Area · 3.10 ha
Weighted across six dimensions · confidence 63%
Scores are not bell-curved. Percentiles and expected scores provide context without changing the underlying model.
Loading map…
The parks map is loading.Explain this score
Where did the 25 come from? Each weighted contribution against a neutral 50 baseline. Green = pushed up; red = pulled down.
Sum of contributions = the headline score. A negative bar means that dimension dragged the park below the city-wide neutral baseline.
Why this park works
Albert Campbell Square works because its edge activation score (5) is middle of the pack and its connectivity (53) is also above-average.
What limits this park
Albert Campbell Square is held back by natural comfort (36, below-average): only 1% canopy means little summer shade; border-vacuum risk is also elevated (84).
Most distinctive characteristic
Most distinctive feature: exceptionally low natural comfort (36, below-average).
Jacobs reading
Albert Campbell Square is currently underperforming on both axes: neither integrated into the city nor offering deep natural respite. A candidate for design intervention.
Tradeoffs
- 25 nearby towers cast wind and shadow without contributing canopy: passive surveillance is plentiful but human-scale comfort is not.
Performance in context
- Strong underperformer relative to its cohort: raw 25 vs an expected 39 (gap -15).
Typology classification
Classified as Civic Square: name flags as civic square + 62 buildings frame the edge
Edge Activation
Within 100 m of the park edge: 33 active uses (retail, transit_stop, restaurant, cafe) and 10 dead/hostile uses (parking_lot). Active edges keep "eyes on the park" through the day; parking lots, blank institutional walls, rail and highway frontages drain street life.
Source: OSM POIs (amenity/shop) + Toronto Building Footprints + land use
Connectivity
Connectivity blends paths, intersections, transit, entrances, and edge density. This park has 0 mapped paths/walkways and 19 sidewalk segments within 50 m; 3 street intersections within 100 m; 50 transit stops within a 400 m walk; 0 estimated access points across ~1,014 m of perimeter. low edge density, significant superblock penalty applied. Source coverage: centreline, pedestrian_network, transit_osm.
Source: Toronto Centreline V2 + Pedestrian Network + OSM transit stops
Amenity Diversity
No amenities recorded. Score is 0 until inventory is loaded.
Source: Toronto Parks & Recreation Facilities + OSM amenity tags
Natural Comfort
Natural-comfort components for this park: ~2.0% effective canopy (0.9% from contiguous tree polygons + scattered tree density); nearest waterbody ~852 m; 9 city-mapped trees inside the polygon (2.9/ha). Reading: exposed. Source coverage: treed_area, waterbodies, street_trees. Impervious surface is approximated (Toronto's authoritative layer ships only as a raster GeoTIFF).
Source: Toronto Treed Area + Ravine + Waterbodies + Street Tree Inventory
Enclosure / Eyes on Park
62 buildings within 25 m of the park edge (23 mid-rise, 14 low-rise, 25 tower); avg edge height 49.0 m (~16 floors); 6.1 buildings per 100 m of 1,014 m perimeter (strong frontage density); edges dominated by towers; 25 towers ≥ 40 m within 25 m of the edge. "Eyes on the park" come strongest from the 23 mid-rise edge buildings.
Source: Toronto 3D Massing (building footprints + heights)
Border Vacuum Risk
Border-vacuum factors within 50 m of the park: parking_lot, parking_lot, parking_lot, parking_lot, parking_lot, parking_lot, parking_lot. Jacobs warned that highways, rail, parking lots and blank institutional edges act as "vacuums" that suppress foot traffic and isolate the park from its neighbourhood.
Source: Toronto Street Centreline (highways) + rail layer + OSM landuse + building footprints
Equity Context
Equity Context requires inputs not yet loaded for this park (Toronto Neighbourhood Profiles). Score is held at a neutral 50 with low confidence. Read with caution.
Source: Toronto Neighbourhood Profiles
Amenities (0)
No amenities recorded for this park.
Nearby active-edge features (80)
- parking lot0 m
- parking lot0 m
- retail: Gong Cha3 m
- retail: Black Diamond Barber Shop4 m
- retail: Venta Skin & Laser Clinic8 m
- cafe: CoCo Fresh Tea & Juice9 m
- retail: Pawny Tail Pet Grooming & More10 m
- retail: Sunlight Super Market & Take Away10 m
- retail: Superhairpieces10 m
- parking lot21 m
- transit stop: Town Centre/Scarborough Centre Station23 m
- parking lot37 m
- parking lot39 m
- parking lot47 m
- parking lot47 m
- transit stop48 m
- retail: Gateway On The Go50 m
- transit stop53 m
- parking lot64 m
- transit stop: Scarborough Centre Station64 m
- transit stop65 m
- transit stop65 m
- transit stop71 m
- transit stop71 m
- transit stop72 m
- parking lot73 m
- transit stop74 m
- transit stop76 m
- parking lot78 m
- transit stop85 m
- transit stop85 m
- transit stop87 m
- retail: Gateway Newstands87 m
- transit stop88 m
- restaurant: Kwan Dim Sum89 m
- restaurant: Thaï Express90 m
- restaurant: Mymy Chicken92 m
- restaurant: Villa Madina92 m
- transit stop93 m
- restaurant: Jimmy the Greek94 m
- retail: Cacao 7095 m
- restaurant: Hakka 6ix95 m
- restaurant: Caribbean Queen97 m
- restaurant: Chipotle101 m
- transit stop: Borough Approach East103 m
- restaurant: Bourbon St. Grill103 m
- restaurant: A&W107 m
- restaurant: New York Fries108 m
- retail: Winners109 m
- restaurant: Chick-fil-A112 m
- cafe: Tim Hortons113 m
- restaurant: Manchu Wok114 m
- restaurant: Shanghai 360114 m
- transit stop: Borough Approach West114 m
- restaurant: Jollibee117 m
- parking lot118 m
- retail: Malvón118 m
- restaurant: Biryani119 m
- retail: Saint Germain Bakery120 m
- restaurant: St. Louis Bar & Grill121 m
- restaurant: Freshly Squeezed123 m
- restaurant: Poulet Rouge123 m
- retail: WirelessWave125 m
- retail: Godiva Chocolatier128 m
- transit stop130 m
- restaurant: Cultures130 m
- cafe: Real Fruit Bubble Tea131 m
- restaurant: KFC134 m
- restaurant: Subway134 m
- cafe: Tim Hortons135 m
- restaurant: Taco Bell136 m
- restaurant: McDonald's137 m
- retail: Swarovski138 m
- retail: Saje138 m
- retail: Muji138 m
- retail: Squish Candies139 m
- retail: Bitter Sweet139 m
- parking lot139 m
- retail: Lindt140 m
- retail: Indigo Spirit141 m
Park profile
Five-axis radar across the structural dimensions.
Citywide percentile ranks
Across all Toronto parks in the dataset.
- Overall vitality11th
- Edge activation65th
- Connectivity61th
- Amenity diversity42th
- Natural comfort25th
- Enclosure26th
Most similar parks
Closest in metric space across the five structural dimensions.
- DON MILLS LIBRARY - Building GroundsParkette30
- Scarborough Hydro Green SpaceNeighbourhood Park34
- City Wide Open SpaceOther22
- WEST ROUGE ELEMENTARY SCHOOL - Building GroundsNeighbourhood Park31
- WESTVIEW CENTENNIAL SECONDARY SCHOOL - Building GroundsNeighbourhood Park28
Most opposite parks
Furthest in metric space. Useful for recognising what kind of park this isn’t.
- Kew GardensNeighbourhood Park71
- Leslie Grove ParkParkette68
- Market Lane ParkUrban Plaza63
- Bellevue Square ParkCivic Square66
- Ryerson Community ParkUrban Plaza60
Human activity signals: not available
No activity signals have landed for this park yet. The model has scored its physical form but it can’t yet say how often it’s programmed, photographed, or walked through. See /data-ethics for what we will and will not collect.
Does this score feel accurate?
Your read of Albert Campbell Squarematters. We’re testing whether the model lines up with how people actually use the park. Submissions are stored locally; no account needed.
Tell us how this park feels
We measure structure (canopy, edges, connectivity). You measure feeling. Both matter, and disagreement is itself useful civic data.
What would improve this park?
Generated from the weakest measured dimensions: a starting point, not a prescription.
- Activate the edges: encourage cafés, retail or community uses on the streets that face the park; replace blank or parking-lot edges where possible.
- Diversify what people can do in the park (playground, washroom, water, shade, performance, sport, garden): even small additions raise this score.
- Increase canopy and reduce paved area. Shade and water features extend usable hours and seasons.
- Mitigate border vacuums (highways, rail, parking) with active programming on the still-permeable edges and treat the hostile edge as a design challenge.
Data sources
- City of Toronto Open Data: Parks (Green Space)Polygon boundaries, official names, types.
- Parks & Recreation FacilitiesInventory of in-park amenities (washrooms, fields, rinks…).
- Toronto Pedestrian NetworkSidewalk segments around and through parks; estimated park entrances.
- Toronto Centreline V2Street segments + intersection nodes near park edges; trails and walkways.
- Toronto 3D MassingBuilding footprints + heights for edge-building counts, frontage density, and tower-in-the-park risk.
- Toronto Treed AreaTree canopy share inside park polygons via stratified-grid sampling.
- Toronto Waterbodies & RiversWater surface inside parks + nearest-water distance for cooling.
- Ravine & Natural Feature ProtectionRavine overlap as a cooling / natural-comfort signal.
- Toronto Street Tree InventoryTree count + density inside park polygons.
- Neighbourhood Profiles(Pending) Equity context proxy.
- OpenStreetMap (Overpass API)Cafés, restaurants, retail, transit stops, parking, highways, rail.