David Pecaut Square
Civic Square, in the top tier overall (score 48, rank ~93th percentile). Strongest: edge activation; weakest: enclosure.
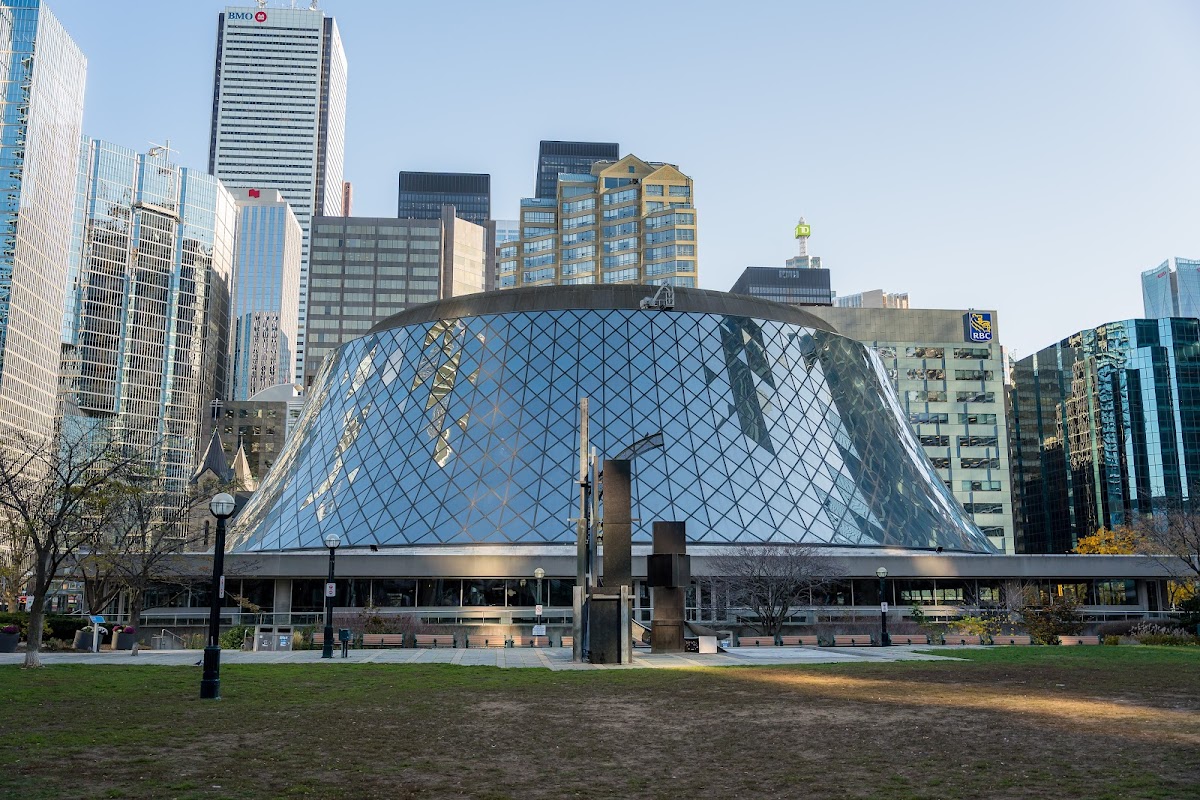
Photo by Manuel Rodil via Google Places · cached 5/9/2026
David Pecaut Square scores 47.5 / 100. Strongest dimensions: edge activation and enclosure / eyes on park. Weakest: amenity diversity (0). Border-vacuum risk is low. This score is a transparent reading of Jane Jacobs-style vitality factors, not a definitive judgment.
Area · 1.18 ha
Weighted across six dimensions · confidence 59%
Scores are not bell-curved. Percentiles and expected scores provide context without changing the underlying model.
Loading map…
The parks map is loading.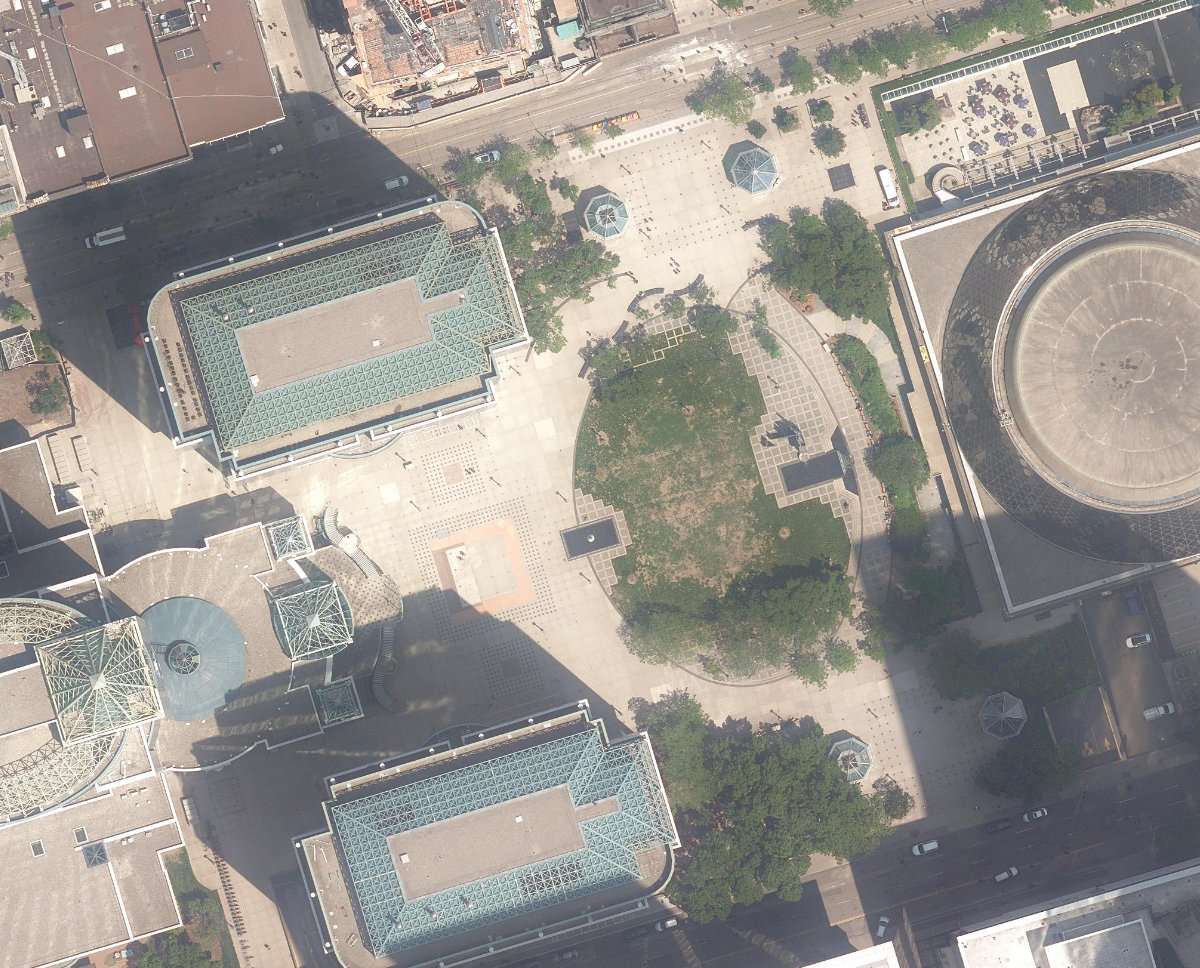
Explain this score
Where did the 48 come from? Each weighted contribution against a neutral 50 baseline. Green = pushed up; red = pulled down.
Sum of contributions = the headline score. A negative bar means that dimension dragged the park below the city-wide neutral baseline.
Why this park works
David Pecaut Square works because its edge activation score (74) is one of the city's strongest and its amenity diversity (0) is also above-average (its perimeter is lined with active uses).
What limits this park
David Pecaut Square is held back by enclosure (55, bottom quartile).
Most distinctive characteristic
Most distinctive feature: exceptionally high edge activation (74, top decile).
Jacobs reading
David Pecaut Square sits between an urban social park and an ecological retreat: moderately useful for both, exceptionally suited to neither.
Tradeoffs
- 17 nearby towers cast wind and shadow without contributing canopy: passive surveillance is plentiful but human-scale comfort is not.
Performance in context
- A modest overperformer for its civic square typology (+8 vs the median in medium Civic Square).
Typology classification
Classified as Civic Square: name flags as civic square + 39 buildings frame the edge
Edge Activation
Within 100 m of the park edge: 51 active uses (restaurant, cafe, retail, transit_stop) and 2 dead/hostile uses (parking_lot). Active edges keep "eyes on the park" through the day; parking lots, blank institutional walls, rail and highway frontages drain street life.
Source: OSM POIs (amenity/shop) + Toronto Building Footprints + land use
Connectivity
Connectivity blends paths, intersections, transit, entrances, and edge density. This park has 0 mapped paths/walkways and 8 sidewalk segments within 50 m; 8 street intersections within 100 m; 28 transit stops within a 400 m walk; 0 estimated access points across ~771 m of perimeter. low edge density, significant superblock penalty applied. Source coverage: centreline, pedestrian_network, transit_osm.
Source: Toronto Centreline V2 + Pedestrian Network + OSM transit stops
Amenity Diversity
No amenities recorded. Score is 0 until inventory is loaded.
Source: Toronto Parks & Recreation Facilities + OSM amenity tags
Natural Comfort
Natural-comfort components for this park: ~8.9% effective canopy (0.0% from contiguous tree polygons + scattered tree density); nearest waterbody ~869 m; 15 city-mapped trees inside the polygon (12.7/ha). Reading: exposed. Source coverage: waterbodies, street_trees. Impervious surface is approximated (Toronto's authoritative layer ships only as a raster GeoTIFF).
Source: Toronto Treed Area + Ravine + Waterbodies + Street Tree Inventory
Enclosure / Eyes on Park
39 buildings within 25 m of the park edge (15 mid-rise, 7 low-rise, 17 tower); avg edge height 54.7 m (~18 floors); 5.1 buildings per 100 m of 771 m perimeter (strong frontage density); edges dominated by towers; 17 towers ≥ 40 m within 25 m of the edge. "Eyes on the park" come strongest from the 15 mid-rise edge buildings.
Source: Toronto 3D Massing (building footprints + heights)
Border Vacuum Risk
Border-vacuum factors within 50 m of the park: Impark, Impark. Jacobs warned that highways, rail, parking lots and blank institutional edges act as "vacuums" that suppress foot traffic and isolate the park from its neighbourhood.
Source: Toronto Street Centreline (highways) + rail layer + OSM landuse + building footprints
Equity Context
Equity Context requires inputs not yet loaded for this park (Toronto Neighbourhood Profiles). Score is held at a neutral 50 with low confidence. Read with caution.
Source: Toronto Neighbourhood Profiles
Amenities (0)
No amenities recorded for this park.
Nearby active-edge features (80)
- retail: MetroCentre0 m
- restaurant: Subway0 m
- restaurant: Jimmy the Greek0 m
- restaurant: Manchu Wok0 m
- restaurant: Pumpernickel's0 m
- restaurant: Booster Juice0 m
- restaurant: Harvest Green0 m
- restaurant: Urban Appetite0 m
- restaurant: Soup Nutsy0 m
- retail0 m
- cafe: Au Pain Doré0 m
- restaurant: Koha Pacific Kitchen0 m
- cafe: Tim Hortons1 m
- retail: Corporate Printing Services3 m
- restaurant: Minami6 m
- parking lot: Impark6 m
- retail: Exton Dry Cleaners9 m
- retail: EZ Eye Care10 m
- retail: Maoka13 m
- restaurant: Dunn's Famous23 m
- restaurant: Empire Supper Club24 m
- retail: It's A Shoe Repair25 m
- retail: Creative Custom Framing27 m
- restaurant: Shoeless Joe's28 m
- restaurant: Oklahoma Burgers29 m
- restaurant: Ritz Bar32 m
- restaurant: Coffee Oysters Champagne35 m
- parking lot: Impark35 m
- cafe: Starbucks37 m
- transit stop: John Street38 m
- retail: Sutherland-Chan Massage Therapy38 m
- restaurant: Dentsu39 m
- restaurant: Lobster Burger Bar39 m
- restaurant: Oniwa Sushi41 m
- restaurant: Harvest Green43 m
- restaurant: Lee Chen Asian Bistro45 m
- restaurant: Sunset Grill49 m
- restaurant: The Shore Club55 m
- restaurant: Charlotte's Room60 m
- retail: Box Office64 m
- restaurant: Byblos Downtown67 m
- restaurant: Hot dog stand70 m
- retail: King Fresh Foodmarket72 m
- cafe: Starbucks73 m
- restaurant: Elephant & Castle74 m
- restaurant: Bar 40481 m
- cafe: Bevy@The Combine86 m
- restaurant: 7 Wonders Fine Foods90 m
- restaurant: Mirvish Parking95 m
- retail: Tiee Express96 m
- cafe: Second Cup96 m
- restaurant: Aroma Fine Indian Cuisine97 m
- restaurant: Grace O'Malley's99 m
- transit stop: University Avenue, St. Andrew Station101 m
- parking lot102 m
- restaurant: A&W103 m
- cafe: Starbucks105 m
- restaurant: Pancho y Emiliano105 m
- restaurant: O&B Canteen105 m
- restaurant: Milagro Cantina Mexicana106 m
- restaurant: Kinoya113 m
- restaurant: Freshly Squeezed114 m
- retail: International News114 m
- retail: Marketplace116 m
- restaurant: Cultures117 m
- retail: New Tech Imaging Inc.117 m
- retail: International News117 m
- restaurant: Hey Lucy's Wood Oven Pizza117 m
- restaurant: Amaya Express119 m
- parking lot119 m
- restaurant: Grill & Wrap121 m
- restaurant: Kit Kat Italian Bar & Grill122 m
- restaurant: Pai Downtown123 m
- parking lot: Impark123 m
- restaurant: Rock N' Horse124 m
- cafe: Starbucks125 m
- restaurant: JZ's Pizza125 m
- restaurant: N'Awlins125 m
- retail: Whole Health126 m
- restaurant: Umi Sushi Express127 m
Park profile
Five-axis radar across the structural dimensions.
Citywide percentile ranks
Across all Toronto parks in the dataset.
- Overall vitality93th
- Edge activation99th
- Connectivity51th
- Amenity diversity67th
- Natural comfort44th
- Enclosure20th
Most similar parks
Closest in metric space across the five structural dimensions.
- Kennedy ParketteParkette47
- Taylor Creek ParkWaterfront Park50
- Toronto Waterfront ParkWaterfront Park43
- Creekside ParkWaterfront Park48
- Scarborough Hydro Green SpaceParkette49
Most opposite parks
Furthest in metric space. Useful for recognising what kind of park this isn’t.
- High ParkRavine / Naturalized Park47
- Trca Lands ( 26)Ravine / Naturalized Park27
- Ramsden ParkRavine / Naturalized Park43
- Earlscourt ParkNeighbourhood Park44
- Toronto Islands - Muggs Island ParkRavine / Naturalized Park25
Visitor signals
Public attention measured by Google Places aggregates. This proxies attention, not occupancy. Aggregate-only: no usernames, no review text, no extra photos beyond the cached hero.
“Tree-lined plaza often used for concerts, with a steel & granite sculpture by Bernie Miller.” (Google editorial summary)
p94 citywide · p83 within Civic Square
Source: Google Places API · match high (0.97 composite confidence) · last refreshed 5/9/2026. Privacy contract. Measures public attention, not occupancy.
Human activity signals: not available
No activity signals have landed for this park yet. The model has scored its physical form but it can’t yet say how often it’s programmed, photographed, or walked through. See /data-ethics for what we will and will not collect.
Does this score feel accurate?
Your read of David Pecaut Squarematters. We’re testing whether the model lines up with how people actually use the park. Submissions are stored locally; no account needed.
Tell us how this park feels
We measure structure (canopy, edges, connectivity). You measure feeling. Both matter, and disagreement is itself useful civic data.
What would improve this park?
Generated from the weakest measured dimensions: a starting point, not a prescription.
- Add or open more entrances and improve sidewalk continuity around the park. More permeability means more spontaneous use.
- Diversify what people can do in the park (playground, washroom, water, shade, performance, sport, garden): even small additions raise this score.
- Increase canopy and reduce paved area. Shade and water features extend usable hours and seasons.
Data sources
- City of Toronto Open Data: Parks (Green Space)Polygon boundaries, official names, types.
- Parks & Recreation FacilitiesInventory of in-park amenities (washrooms, fields, rinks…).
- Toronto Pedestrian NetworkSidewalk segments around and through parks; estimated park entrances.
- Toronto Centreline V2Street segments + intersection nodes near park edges; trails and walkways.
- Toronto 3D MassingBuilding footprints + heights for edge-building counts, frontage density, and tower-in-the-park risk.
- Toronto Treed AreaTree canopy share inside park polygons via stratified-grid sampling.
- Toronto Waterbodies & RiversWater surface inside parks + nearest-water distance for cooling.
- Ravine & Natural Feature ProtectionRavine overlap as a cooling / natural-comfort signal.
- Toronto Street Tree InventoryTree count + density inside park polygons.
- Neighbourhood Profiles(Pending) Equity context proxy.
- OpenStreetMap (Overpass API)Cafés, restaurants, retail, transit stops, parking, highways, rail.