Breadalbane Park
Urban Plaza, one of the city's strongest overall (score 54, rank ~98th percentile). Strongest: edge activation; weakest: connectivity.
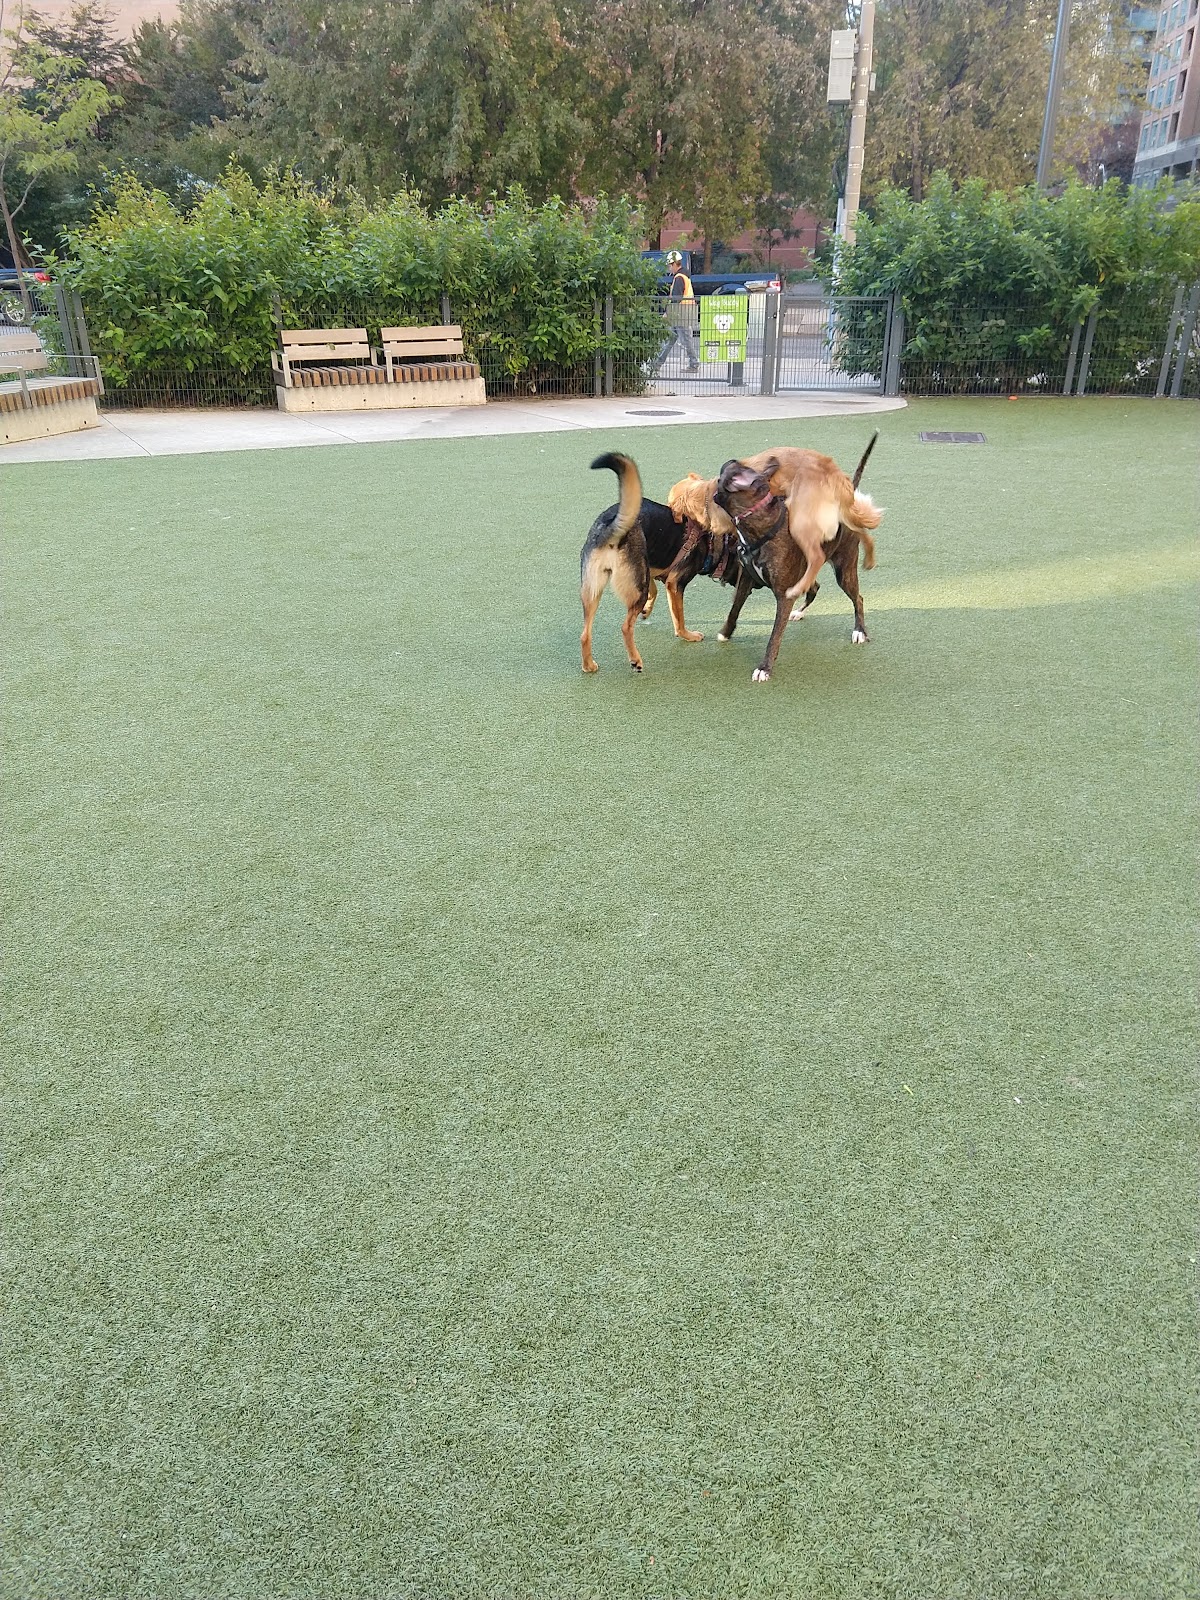
Photo by Chris via Google Places · cached 5/9/2026
Breadalbane Park scores 54.2 / 100. Strongest dimensions: enclosure / eyes on park and edge activation. Weakest: amenity diversity (21). Border-vacuum risk is low. This score is a transparent reading of Jane Jacobs-style vitality factors — not a definitive judgment.
Area · 0.15 ha
Weighted across six dimensions · confidence 63%
Scores are not bell-curved. Percentiles and expected scores provide context without changing the underlying model.
Street context
Park polygon highlighted on the citywide map. Connectivity, transit, and edge conditions read at a glance.
Top-down view
City of Toronto orthophoto, ~8 cm/px. Reads the park’s footprint, paths, treed area, and edge conditions from above.
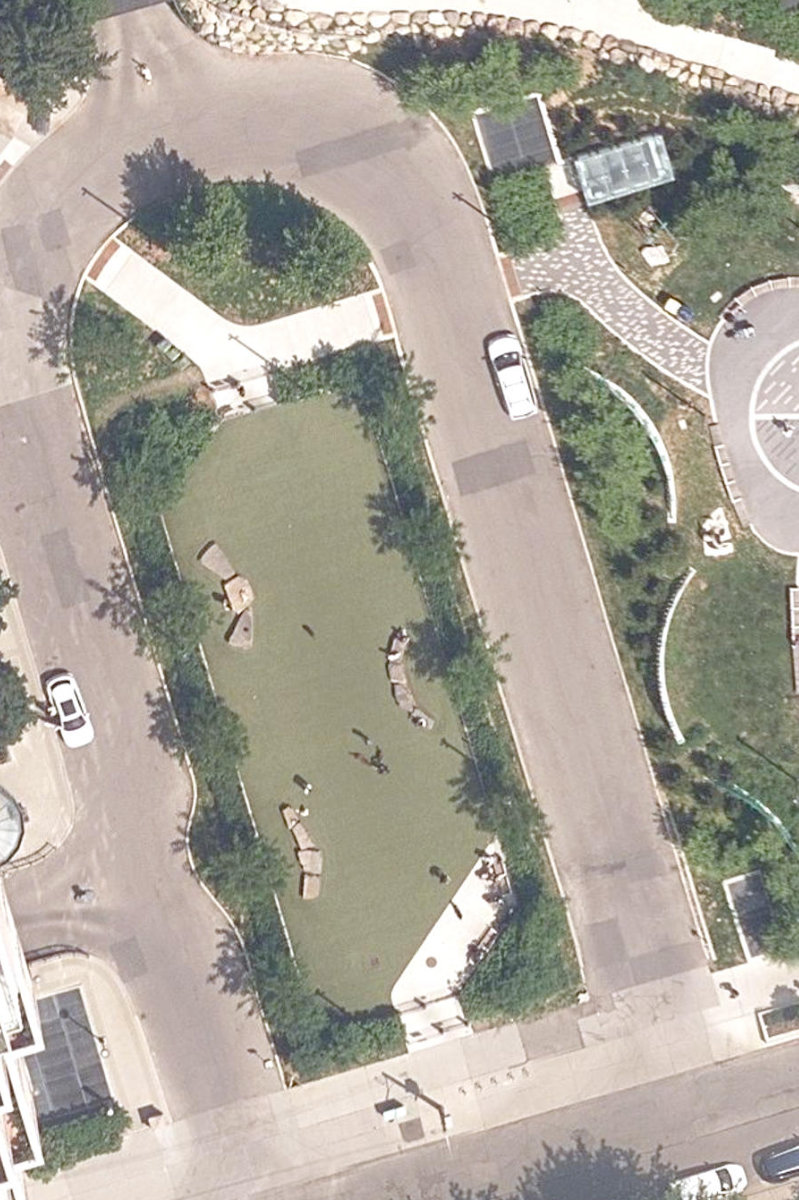
City of Toronto Orthophoto · cot_ortho most-current MapServer
Explain this score
Where did the 54 come from? Each weighted contribution against a neutral 50 baseline. Green = pushed up; red = pulled down.
Sum of contributions = the headline score. A negative bar means that dimension dragged the park below the city-wide neutral baseline.
Why this park works
What limits this park
Most distinctive characteristic
Jacobs reading
Performance in context
- This park is a strong overperformer for its cohort — raw 54 versus an expected 36 for similar parks (pocket Urban Plaza) (gap +18).
Typology classification
Classified as Urban Plaza: 1531 m², paved (0% canopy), 82.2 buildings/100 m
Edge Activation
Within 100 m of the park edge: 25 active uses (transit_stop, retail, cafe, restaurant) and 2 dead/hostile uses (parking_lot). Active edges keep "eyes on the park" through the day; parking lots, blank institutional walls, rail and highway frontages drain street life.
Source: OSM POIs (amenity/shop) + Toronto Building Footprints + land use
Connectivity
Connectivity blends paths, intersections, transit, entrances, and edge density. This park has 0 mapped paths/walkways and 5 sidewalk segments within 50 m; 5 street intersections within 100 m; 39 transit stops within a 400 m walk; 0 estimated access points across ~168 m of perimeter. moderate edge density — small superblock penalty applied. Source coverage: centreline, pedestrian_network, transit_osm.
Source: Toronto Centreline V2 + Pedestrian Network + OSM transit stops
Amenity Diversity
2 distinct amenity types in the park (dog_area, playground). Diversity, not raw count, drives the score so a park with many distinct activity types can outrank a larger park that repeats the same use.
Source: Toronto Parks & Recreation Facilities + OSM amenity tags
Natural Comfort
Natural Comfort requires inputs not yet loaded for this park (Treed Area / Ravine / Waterbodies / Street Trees). Score is held at a neutral 50 with low confidence — read with caution.
Source: Treed Area / Ravine / Waterbodies / Street Trees
Enclosure / Eyes on Park
138 buildings within 25 m of the park edge (71 mid-rise, 13 low-rise, 54 tower); avg edge height 42.2 m (~14 floors); 82.2 buildings per 100 m of 168 m perimeter — strong frontage density; edges dominated by towers; 54 towers ≥ 40 m within 25 m of the edge. "Eyes on the park" come strongest from the 71 mid-rise edge buildings.
Source: Toronto 3D Massing (building footprints + heights)
Border Vacuum Risk
Park edges face the city — no significant border vacuum detected.
Source: Toronto Street Centreline (highways) + rail layer + OSM landuse + building footprints
Equity Context
Equity Context requires inputs not yet loaded for this park (Toronto Neighbourhood Profiles). Score is held at a neutral 50 with low confidence — read with caution.
Source: Toronto Neighbourhood Profiles
Amenities (2 types · 2 records)
- dog area
- playground
Nearby active-edge features (80)
- retail — Signs & Prints36 m
- retail — Venus Nails & Esthetics37 m
- restaurant — Subway38 m
- retail — Rogers41 m
- retail — Cha Payom47 m
- restaurant — Sweetpepper51 m
- retail — LOCO SPACE51 m
- retail — L3 Digital Print & Copy59 m
- retail64 m
- transit stop — Wellesley Street West65 m
- retail — My Touch Beauty Spa & Salon66 m
- retail — Platis Cleaners68 m
- cafe — City Bakery & Cafe71 m
- retail — Rabba72 m
- restaurant — Ali Baba's72 m
- transit stop — Bay Street75 m
- transit stop — Wellesley Street West78 m
- retail — Excelsior Cleaners80 m
- parking lot80 m
- retail — E-Blue Esport Stadium82 m
- parking lot85 m
- restaurant — Sushi Garden91 m
- retail — T.O. Condos94 m
- cafe — Second Cup98 m
- retail — Sign-O-Rama99 m
- transit stop — Bay Street99 m
- restaurant — Fish Buy Buy100 m
- retail — Au Pain Doré100 m
- parking lot105 m
- retail — Shu Cake107 m
- retail — Chakra Healing Zone108 m
- retail — Lu Dream Spa108 m
- retail — La Para109 m
- restaurant — BOKU (Yonge St.)109 m
- restaurant — Freshii110 m
- retail110 m
- restaurant — Woojoo Bunsik111 m
- restaurant — Mr Tonkasu111 m
- transit stop — Wellesley111 m
- cafe — Charles Tea111 m
- restaurant — Taqueria El Pastorictio111 m
- restaurant — McDonald's111 m
- retail — Lamoure112 m
- retail — Exposures Photography112 m
- retail — Galleria Supermarket Express112 m
- retail — United Perfumes & Cellular113 m
- restaurant — The Fry113 m
- retail — Adult Mart113 m
- retail113 m
- retail — Ralph's Barber Shop114 m
- retail115 m
- retail — Van-Thi Barber & Hair Stylist;Van Barber & Hair Stylists115 m
- retail116 m
- restaurant116 m
- restaurant — ramen RAIJIN117 m
- retail117 m
- retail — Kream117 m
- retail118 m
- restaurant — Slay Fruits119 m
- restaurant — Bone Soup Malatang119 m
- retail — Ultra Convenience120 m
- retail — Super Vape121 m
- transit stop — Grosvenor Street122 m
- retail — Effi Bike122 m
- transit stop — Yonge Street123 m
- highway — Yonge Street123 m
- cafe — Tim Hortons124 m
- retail — Henri's Optical124 m
- restaurant — Taning Lemon Tea126 m
- restaurant — Diyijia128 m
- restaurant — Mars Village Eatery130 m
- retail131 m
- retail — Kawaii Spa131 m
- transit stop — Wellesley Street West132 m
- retail — Coach House Tavern Restaurant133 m
- restaurant — Darvish Persian Cuisine133 m
- retail134 m
- retail — Dollarama135 m
- cafe — ChaHalo135 m
- restaurant — Rolltation136 m
Park profile
Five-axis radar across the structural dimensions.
Citywide percentile ranks
Across all Toronto parks in the dataset.
- Overall vitality98th
- Edge activation99th
- Connectivity44th
- Amenity diversity88th
- Natural comfort60th
- Enclosure75th
Most similar parks
Closest in metric space across the five structural dimensions.
- FRANK OKE SECONDARY SCHOOL - Building GroundsNeighbourhood Park49
- Elijah ParkCorridor / Linear Park50
- Hto Park WestCorridor / Linear Park49
- O'Shea WalkwayUrban Plaza51
- HOLY CROSS CATHOLIC SECONDARY SCHOOL - Building GroundsParkette51
Most opposite parks
Furthest in metric space — useful for recognising what kind of park this isn’t.
- Trca Lands ( 26)Ravine / Naturalized Park27
- Toronto Islands - Muggs Island ParkRavine / Naturalized Park25
- Rouge ParkWaterfront Park25
- Rouge ParkRavine / Naturalized Park28
- Rouge ParkRavine / Naturalized Park21
Visitor signals
Public attention measured by Google Places aggregates. This proxies attention, not occupancy. Aggregate-only — no usernames, no review text, no extra photos beyond the cached hero.
p61 citywide · p60 within Urban Plaza
Source: Google Places API · match unverified (0.00 composite confidence) · last refreshed 5/9/2026. Privacy contract. Measures public attention, not occupancy.
Human activity signals
Programming, social attention, temporal rhythm, and nearby pedestrian / cycling flow. An experimental aggregate layer that complements the spatial scores — partial coverage, partial confidence.
Activity reading: no inputs available. The strongest signal is consistent rhythm across the day. Source coverage: google-places.
Does this score feel accurate?
Your read of Breadalbane Parkmatters. We’re testing whether the model lines up with how people actually use the park. Submissions are stored locally; no account needed.
Tell us how this park feels
We measure structure (canopy, edges, connectivity). You measure feeling. Both matter — and disagreement is itself useful civic data.
What would improve this park?
Generated from the weakest measured dimensions — a starting point, not a prescription.
- Add or open more entrances and improve sidewalk continuity around the park. More permeability means more spontaneous use.
- Diversify what people can do in the park — playground, washroom, water, shade, performance, sport, garden — even small additions raise this score.
Data sources
- City of Toronto Open Data — Parks (Green Space)Polygon boundaries, official names, types.
- Parks & Recreation FacilitiesInventory of in-park amenities (washrooms, fields, rinks…).
- Toronto Pedestrian NetworkSidewalk segments around and through parks; estimated park entrances.
- Toronto Centreline V2Street segments + intersection nodes near park edges; trails and walkways.
- Toronto 3D MassingBuilding footprints + heights for edge-building counts, frontage density, and tower-in-the-park risk.
- Toronto Treed AreaTree canopy share inside park polygons via stratified-grid sampling.
- Toronto Waterbodies & RiversWater surface inside parks + nearest-water distance for cooling.
- Ravine & Natural Feature ProtectionRavine overlap as a cooling / natural-comfort signal.
- Toronto Street Tree InventoryTree count + density inside park polygons.
- Neighbourhood Profiles(Pending) Equity context proxy.
- OpenStreetMap (Overpass API)Cafés, restaurants, retail, transit stops, parking, highways, rail.