Hto Park West
Corridor / Linear Park, in the top tier overall (score 49, rank ~95th percentile). Strongest: edge activation; weakest: amenity diversity.
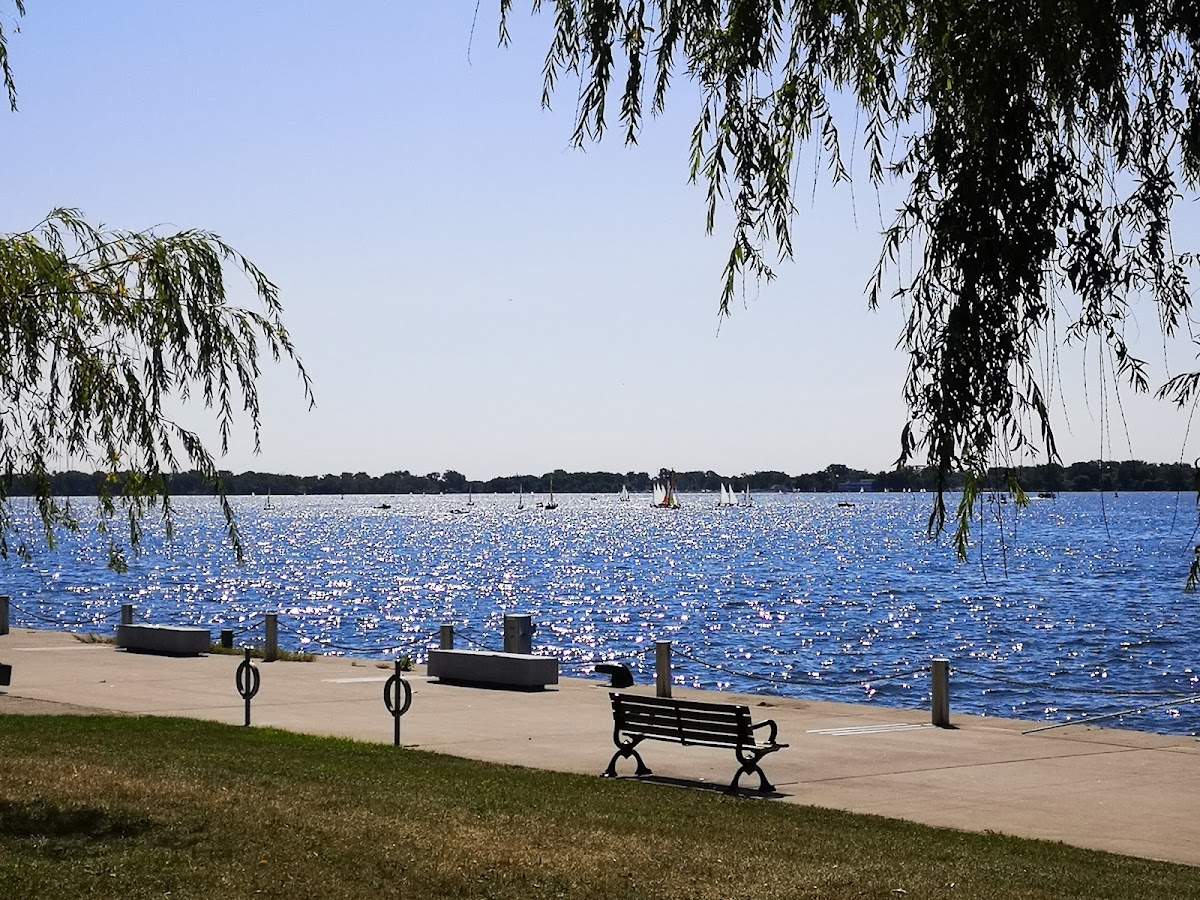
Photo by Amy McAuley via Google Places · cached 5/9/2026
Hto Park West scores 49.2 / 100. Strongest dimensions: enclosure / eyes on park and edge activation. Weakest: amenity diversity (0). Border-vacuum risk is low. This score is a transparent reading of Jane Jacobs-style vitality factors, not a definitive judgment.
Area · 0.61 ha
Weighted across six dimensions · confidence 59%
Scores are not bell-curved. Percentiles and expected scores provide context without changing the underlying model.
Loading map…
The parks map is loading.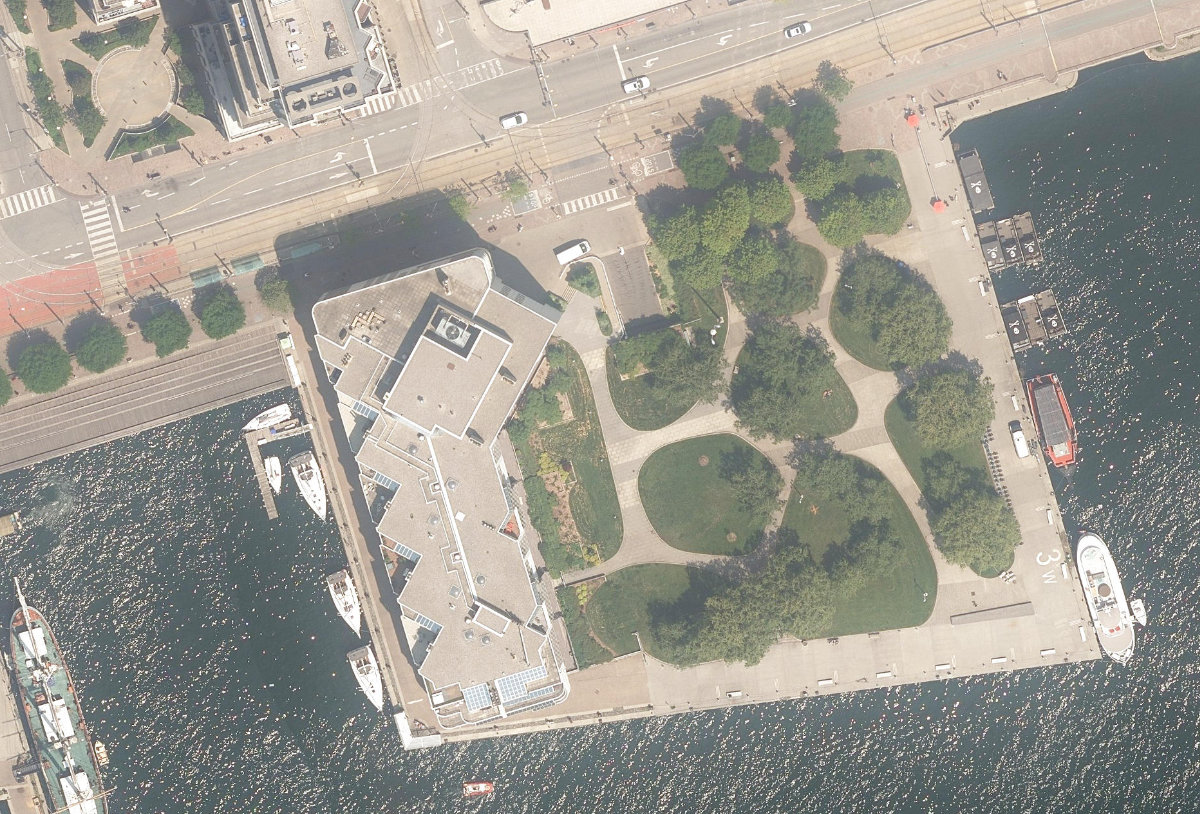
Explain this score
Where did the 49 come from? Each weighted contribution against a neutral 50 baseline. Green = pushed up; red = pulled down.
Sum of contributions = the headline score. A negative bar means that dimension dragged the park below the city-wide neutral baseline.
Why this park works
Hto Park West works because its edge activation score (63) is one of the city's strongest and its enclosure (73) is also above-average (its perimeter is lined with active uses).
What limits this park
Hto Park West doesn't have a clear weakness. Every measured dimension is at or above the middle of the pack.
Most distinctive characteristic
Most distinctive feature: exceptionally high edge activation (63, top decile).
Jacobs reading
Hto Park West sits between an urban social park and an ecological retreat: moderately useful for both, exceptionally suited to neither.
Tradeoffs
- 6 nearby towers cast wind and shadow without contributing canopy: passive surveillance is plentiful but human-scale comfort is not.
Performance in context
- This park is a strong overperformer for its cohort: raw 49 versus an expected 32 for similar parks (small Corridor / Linear Park) (gap +17).
Typology classification
Classified as Corridor / Linear Park: shape elongation 2.4× a circle of equal area. Secondary read: Waterfront Park (nearest waterbody within ~48 m).
Edge Activation
Within 100 m of the park edge: 15 active uses (transit_stop, retail, restaurant) and 1 dead/hostile uses (parking_lot). Active edges keep "eyes on the park" through the day; parking lots, blank institutional walls, rail and highway frontages drain street life.
Source: OSM POIs (amenity/shop) + Toronto Building Footprints + land use
Connectivity
Connectivity blends paths, intersections, transit, entrances, and edge density. This park has 3 mapped paths/walkways and 14 sidewalk segments within 50 m; 1 street intersections within 100 m; 8 transit stops within a 400 m walk; 3 estimated access points across ~667 m of perimeter. low edge density, significant superblock penalty applied. Source coverage: centreline, pedestrian_network, transit_osm.
Source: Toronto Centreline V2 + Pedestrian Network + OSM transit stops
Amenity Diversity
No amenities recorded. Score is 0 until inventory is loaded.
Source: Toronto Parks & Recreation Facilities + OSM amenity tags
Natural Comfort
Natural-comfort components for this park: ~8.4% effective canopy (0.0% from contiguous tree polygons + scattered tree density); nearest waterbody ~48 m; 12 city-mapped trees inside the polygon (12.0/ha). Reading: water-cooled. Source coverage: waterbodies, street_trees. Impervious surface is approximated (Toronto's authoritative layer ships only as a raster GeoTIFF).
Source: Toronto Treed Area + Ravine + Waterbodies + Street Tree Inventory
Enclosure / Eyes on Park
36 buildings within 25 m of the park edge (25 mid-rise, 5 low-rise, 6 tower); avg edge height 27.3 m (~9 floors); 5.4 buildings per 100 m of 667 m perimeter (strong frontage density); edges lean tall but still framed; 6 towers ≥ 40 m within 25 m of the edge. "Eyes on the park" come strongest from the 25 mid-rise edge buildings.
Source: Toronto 3D Massing (building footprints + heights)
Border Vacuum Risk
Park edges face the city. No significant border vacuum detected.
Source: Toronto Street Centreline (highways) + rail layer + OSM landuse + building footprints
Equity Context
Equity Context requires inputs not yet loaded for this park (Toronto Neighbourhood Profiles). Score is held at a neutral 50 with low confidence. Read with caution.
Source: Toronto Neighbourhood Profiles
Amenities (0)
No amenities recorded for this park.
Nearby active-edge features (37)
- transit stop: Spadina Avenue/Queens Quay West13 m
- retail: Lakeview Convenience32 m
- retail: Lakeview Tower Beauty Salon Nails & Spa32 m
- retail: Hildas Cleaners35 m
- retail: Dream Cyclery36 m
- retail: Sculpture Nails and Spa48 m
- retail53 m
- retail: Convenience Store & Dry Cleaning61 m
- transit stop: Spadina Avenue68 m
- restaurant: Subway68 m
- transit stop: Spadina Avenue76 m
- restaurant: Porticello Restaurant77 m
- retail80 m
- transit stop: Queens Quay Loop at Lower Spadina Ave90 m
- retail: Omnya Health94 m
- parking lot99 m
- parking lot104 m
- highway: Lake Shore Boulevard West107 m
- highway: Lake Shore Boulevard West110 m
- highway: Lake Shore Boulevard West113 m
- parking lot114 m
- retail: RP Nails115 m
- highway: Gardiner Expressway117 m
- retail: Solace Tanning Studios123 m
- cafe: Music Garden Cafe131 m
- highway: Lake Shore Boulevard West135 m
- highway: Gardiner Expressway153 m
- retail: Edible Arrangements160 m
- highway: Lake Shore Boulevard West160 m
- highway: Lake Shore Boulevard West168 m
- retail: Harbourfront Eye Care170 m
- highway: Lake Shore Boulevard West171 m
- parking lot: Harbourfront Parking Lot P3179 m
- retail: Cosmopawlitan180 m
- highway: Lake Shore Boulevard West185 m
- highway: Gardiner Expressway187 m
- highway: Lake Shore Boulevard West194 m
Park profile
Five-axis radar across the structural dimensions.
Citywide percentile ranks
Across all Toronto parks in the dataset.
- Overall vitality95th
- Edge activation99th
- Connectivity48th
- Amenity diversity38th
- Natural comfort48th
- Enclosure74th
Most similar parks
Closest in metric space across the five structural dimensions.
- O'Shea WalkwayUrban Plaza51
- City Wide Open SpaceUrban Plaza50
- Maple Claire ParkUrban Plaza48
- Creekside ParkWaterfront Park48
- Spadina Quay WetlandsUrban Plaza50
Most opposite parks
Furthest in metric space. Useful for recognising what kind of park this isn’t.
- Trca Lands ( 26)Ravine / Naturalized Park27
- Toronto Islands - Muggs Island ParkRavine / Naturalized Park25
- Rouge ParkRavine / Naturalized Park28
- Rouge ParkWaterfront Park25
- Rouge ParkRavine / Naturalized Park26
Visitor signals
Public attention measured by Google Places aggregates. This proxies attention, not occupancy. Aggregate-only: no usernames, no review text, no extra photos beyond the cached hero.
p81 citywide · p90 within Corridor / Linear Park
Source: Google Places API · match high (0.97 composite confidence) · last refreshed 5/9/2026. Privacy contract. Measures public attention, not occupancy.
Human activity signals: not available
No activity signals have landed for this park yet. The model has scored its physical form but it can’t yet say how often it’s programmed, photographed, or walked through. See /data-ethics for what we will and will not collect.
Does this score feel accurate?
Your read of Hto Park Westmatters. We’re testing whether the model lines up with how people actually use the park. Submissions are stored locally; no account needed.
Tell us how this park feels
We measure structure (canopy, edges, connectivity). You measure feeling. Both matter, and disagreement is itself useful civic data.
What would improve this park?
Generated from the weakest measured dimensions: a starting point, not a prescription.
- Add or open more entrances and improve sidewalk continuity around the park. More permeability means more spontaneous use.
- Diversify what people can do in the park (playground, washroom, water, shade, performance, sport, garden): even small additions raise this score.
- Increase canopy and reduce paved area. Shade and water features extend usable hours and seasons.
Data sources
- City of Toronto Open Data: Parks (Green Space)Polygon boundaries, official names, types.
- Parks & Recreation FacilitiesInventory of in-park amenities (washrooms, fields, rinks…).
- Toronto Pedestrian NetworkSidewalk segments around and through parks; estimated park entrances.
- Toronto Centreline V2Street segments + intersection nodes near park edges; trails and walkways.
- Toronto 3D MassingBuilding footprints + heights for edge-building counts, frontage density, and tower-in-the-park risk.
- Toronto Treed AreaTree canopy share inside park polygons via stratified-grid sampling.
- Toronto Waterbodies & RiversWater surface inside parks + nearest-water distance for cooling.
- Ravine & Natural Feature ProtectionRavine overlap as a cooling / natural-comfort signal.
- Toronto Street Tree InventoryTree count + density inside park polygons.
- Neighbourhood Profiles(Pending) Equity context proxy.
- OpenStreetMap (Overpass API)Cafés, restaurants, retail, transit stops, parking, highways, rail.