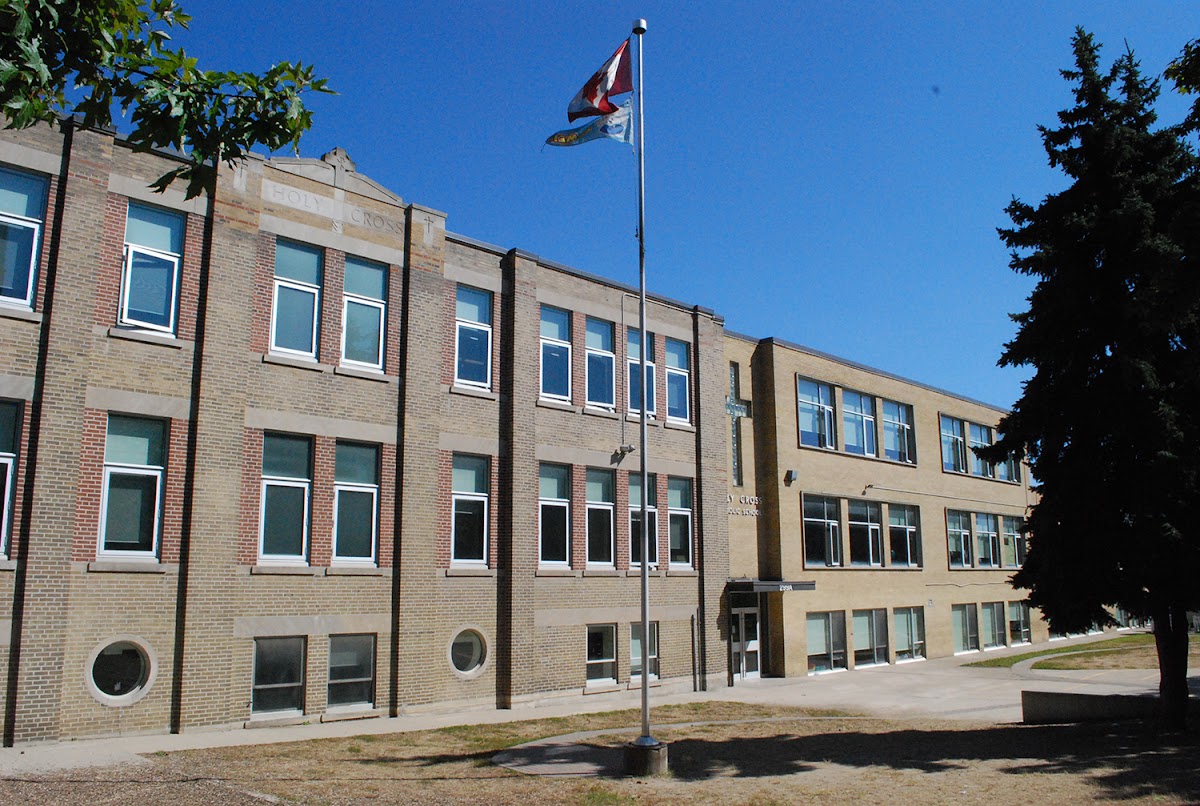
HOLY CROSS CATHOLIC SECONDARY SCHOOL - Building Grounds
Parkette, one of the city's strongest overall (score 51, rank ~96th percentile). Strongest: edge activation; weakest: natural comfort.
Photo by Holy Cross Catholic School via Google Places · cached 5/9/2026
HOLY CROSS CATHOLIC SECONDARY SCHOOL - Building Grounds scores 51.1 / 100. Strongest dimensions: enclosure / eyes on park and connectivity. Weakest: amenity diversity (11.9). Border-vacuum risk is low. This score is a transparent reading of Jane Jacobs-style vitality factors, not a definitive judgment.
Area · 0.90 ha
Weighted across six dimensions · confidence 68%
Scores are not bell-curved. Percentiles and expected scores provide context without changing the underlying model.
Loading map…
The parks map is loading.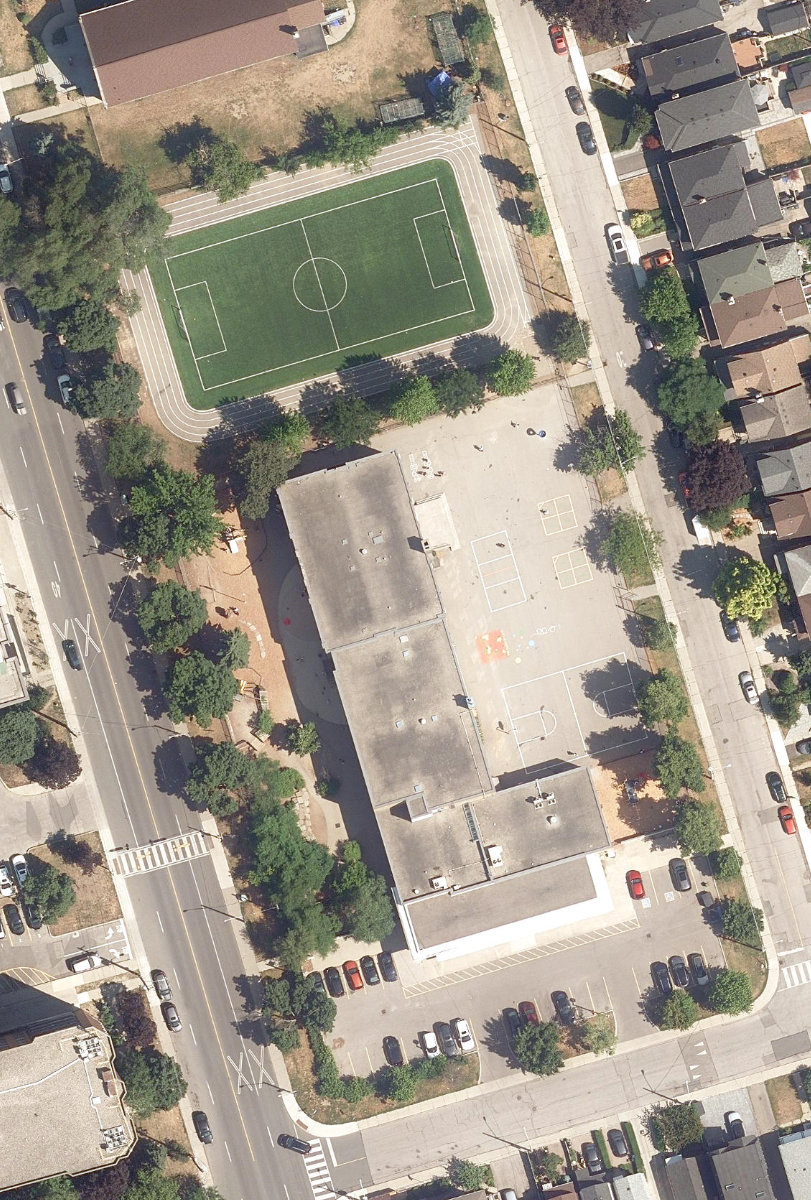
Explain this score
Where did the 51 come from? Each weighted contribution against a neutral 50 baseline. Green = pushed up; red = pulled down.
Sum of contributions = the headline score. A negative bar means that dimension dragged the park below the city-wide neutral baseline.
Why this park works
HOLY CROSS CATHOLIC SECONDARY SCHOOL - Building Grounds works because its edge activation score (52) is one of the city's strongest and its amenity diversity (12) is also top quartile (its perimeter is lined with active uses).
What limits this park
HOLY CROSS CATHOLIC SECONDARY SCHOOL - Building Grounds doesn't have a clear weakness. Every measured dimension is at or above the middle of the pack.
Most distinctive characteristic
Most distinctive feature: exceptionally high edge activation (52, top decile).
Jacobs reading
HOLY CROSS CATHOLIC SECONDARY SCHOOL - Building Grounds sits between an urban social park and an ecological retreat: moderately useful for both, exceptionally suited to neither.
Performance in context
- This park is a strong overperformer for its cohort: raw 51 versus an expected 36 for similar parks (small Parkette) (gap +15).
Typology classification
Classified as Parkette: small (8992 m²) with strong building frontage (28.1 per 100 m)
Edge Activation
Within 100 m of the park edge: 9 active uses (retail, transit_stop) and 1 dead/hostile uses (parking_lot). Active edges keep "eyes on the park" through the day; parking lots, blank institutional walls, rail and highway frontages drain street life.
Source: OSM POIs (amenity/shop) + Toronto Building Footprints + land use
Connectivity
Connectivity blends paths, intersections, transit, entrances, and edge density. This park has 0 mapped paths/walkways and 19 sidewalk segments within 50 m; 13 street intersections within 100 m; 23 transit stops within a 400 m walk; 0 estimated access points across ~406 m of perimeter. edge density is healthy, no superblock penalty. Source coverage: centreline, pedestrian_network, transit_osm.
Source: Toronto Centreline V2 + Pedestrian Network + OSM transit stops
Amenity Diversity
1 distinct amenity types in the park (community_centre). Diversity, not raw count, drives the score so a park with many distinct activity types can outrank a larger park that repeats the same use.
Source: Toronto Parks & Recreation Facilities + OSM amenity tags
Natural Comfort
Natural-comfort components for this park: ~12.6% effective canopy (0.0% from contiguous tree polygons + scattered tree density); nearest waterbody ~934 m; 18 city-mapped trees inside the polygon (18.0/ha). Reading: exposed. Source coverage: waterbodies, street_trees. Impervious surface is approximated (Toronto's authoritative layer ships only as a raster GeoTIFF).
Source: Toronto Treed Area + Ravine + Waterbodies + Street Tree Inventory
Enclosure / Eyes on Park
114 buildings within 25 m of the park edge (8 mid-rise, 105 low-rise, 1 tower); avg edge height 6.5 m (~2 floors); 28.1 buildings per 100 m of 406 m perimeter (strong frontage density); edges are low-rise (mostly 2 to 3 floors); 1 tower ≥ 40 m within 25 m of the edge. "Eyes on the park" come strongest from the 8 mid-rise edge buildings.
Source: Toronto 3D Massing (building footprints + heights)
Border Vacuum Risk
Border-vacuum factors within 50 m of the park: parking_lot. Jacobs warned that highways, rail, parking lots and blank institutional edges act as "vacuums" that suppress foot traffic and isolate the park from its neighbourhood.
Source: Toronto Street Centreline (highways) + rail layer + OSM landuse + building footprints
Equity Context
Equity Context requires inputs not yet loaded for this park (Toronto Neighbourhood Profiles). Score is held at a neutral 50 with low confidence. Read with caution.
Source: Toronto Neighbourhood Profiles
Amenities (1 types · 1 records)
- community centre
Nearby active-edge features (12)
- parking lot0 m
- transit stop: Cosburn Avenue20 m
- retail: Shopping Basket22 m
- transit stop: Donlands Ave at Memorial Park Ave26 m
- retail: Hair & More Salon32 m
- retail: Blaircourt Convenience33 m
- transit stop: Cosburn Avenue36 m
- transit stop: Donlands Ave at Floyd Ave42 m
- transit stop: Cosburn Ave at Donlands Ave46 m
- transit stop: Cosburn Ave at Donlands Ave63 m
- transit stop136 m
- restaurant: Ritz Restaurant144 m
Park profile
Five-axis radar across the structural dimensions.
Citywide percentile ranks
Across all Toronto parks in the dataset.
- Overall vitality96th
- Edge activation96th
- Connectivity77th
- Amenity diversity80th
- Natural comfort52th
- Enclosure80th
Most similar parks
Closest in metric space across the five structural dimensions.
- Elijah ParkCorridor / Linear Park50
- S.H. ARMSTRONG COMMUNITY CENTRE - Building GroundsNeighbourhood Park49
- HILLCREST COMMUNITY CENTRE - Building GroundsParkette54
- Art Eggleton ParkUrban Plaza56
- Thompson Street ParketteUrban Plaza50
Most opposite parks
Furthest in metric space. Useful for recognising what kind of park this isn’t.
- Trca Lands ( 26)Ravine / Naturalized Park27
- Toronto Islands - Muggs Island ParkRavine / Naturalized Park25
- Rouge ParkRavine / Naturalized Park28
- Rouge ParkWaterfront Park25
- Rouge ParkRavine / Naturalized Park26
Human activity signals: not available
No activity signals have landed for this park yet. The model has scored its physical form but it can’t yet say how often it’s programmed, photographed, or walked through. See /data-ethics for what we will and will not collect.
Does this score feel accurate?
Your read of HOLY CROSS CATHOLIC SECONDARY SCHOOL - Building Groundsmatters. We’re testing whether the model lines up with how people actually use the park. Submissions are stored locally; no account needed.
Tell us how this park feels
We measure structure (canopy, edges, connectivity). You measure feeling. Both matter, and disagreement is itself useful civic data.
What would improve this park?
Generated from the weakest measured dimensions: a starting point, not a prescription.
- Diversify what people can do in the park (playground, washroom, water, shade, performance, sport, garden): even small additions raise this score.
- Increase canopy and reduce paved area. Shade and water features extend usable hours and seasons.
Data sources
- City of Toronto Open Data: Parks (Green Space)Polygon boundaries, official names, types.
- Parks & Recreation FacilitiesInventory of in-park amenities (washrooms, fields, rinks…).
- Toronto Pedestrian NetworkSidewalk segments around and through parks; estimated park entrances.
- Toronto Centreline V2Street segments + intersection nodes near park edges; trails and walkways.
- Toronto 3D MassingBuilding footprints + heights for edge-building counts, frontage density, and tower-in-the-park risk.
- Toronto Treed AreaTree canopy share inside park polygons via stratified-grid sampling.
- Toronto Waterbodies & RiversWater surface inside parks + nearest-water distance for cooling.
- Ravine & Natural Feature ProtectionRavine overlap as a cooling / natural-comfort signal.
- Toronto Street Tree InventoryTree count + density inside park polygons.
- Neighbourhood Profiles(Pending) Equity context proxy.
- OpenStreetMap (Overpass API)Cafés, restaurants, retail, transit stops, parking, highways, rail.