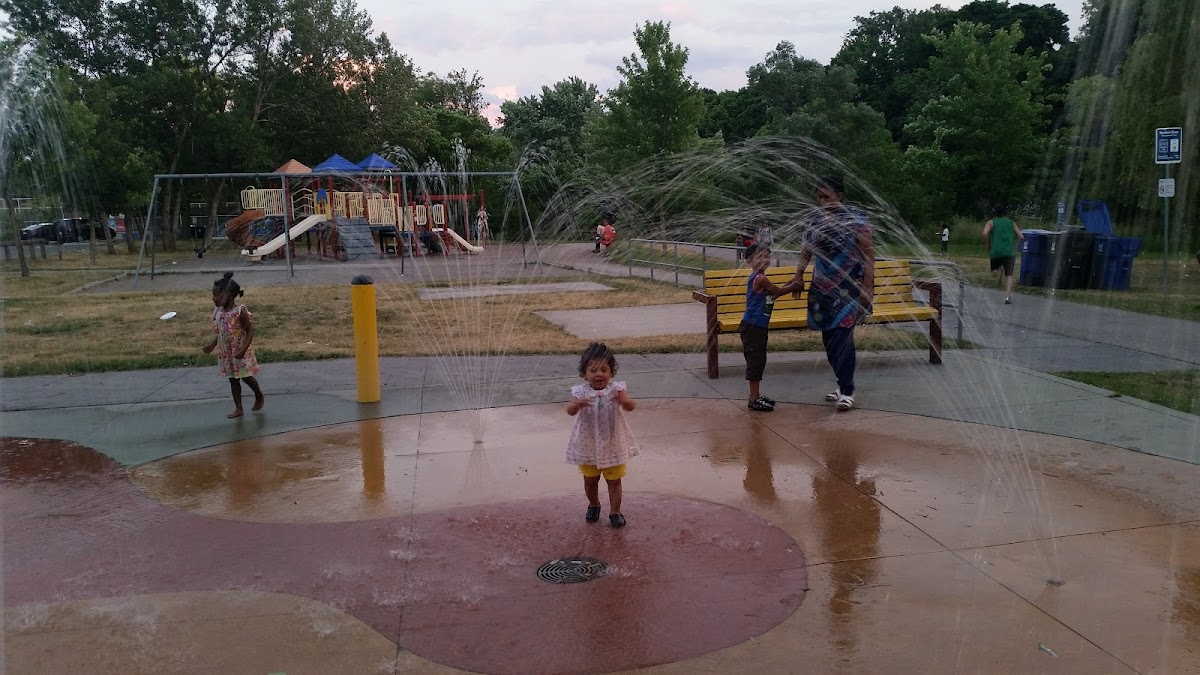
Weston Lions Park
Ravine / Naturalized Park, above average overall (score 43, rank ~85th percentile). Strongest: amenity diversity; weakest: edge activation.
Photo by Khandaker Islam via Google Places · cached 5/9/2026
Weston Lions Park scores 42.8 / 100. Strongest dimensions: connectivity and enclosure / eyes on park. Weakest: edge activation (0). Border-vacuum risk is elevated (72). This score is a transparent reading of Jane Jacobs-style vitality factors, not a definitive judgment.
Area · 7.43 ha
Weighted across six dimensions · confidence 72%
Scores are not bell-curved. Percentiles and expected scores provide context without changing the underlying model.
Loading map…
The parks map is loading.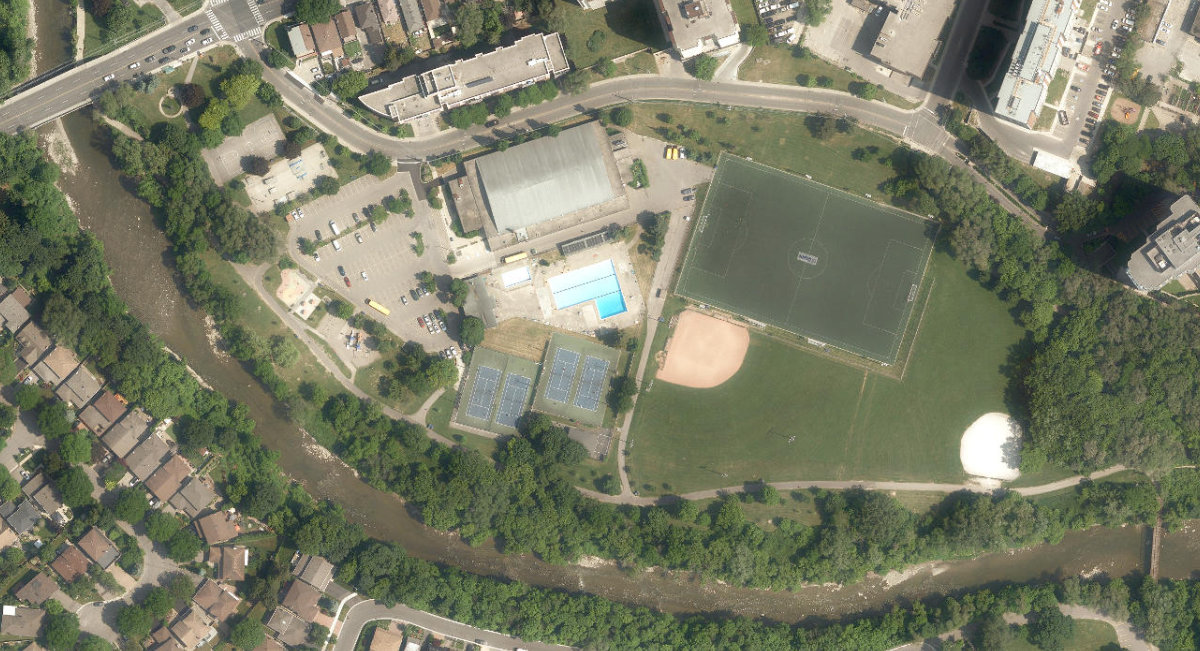
Explain this score
Where did the 43 come from? Each weighted contribution against a neutral 50 baseline. Green = pushed up; red = pulled down.
Sum of contributions = the headline score. A negative bar means that dimension dragged the park below the city-wide neutral baseline.
Why this park works
Weston Lions Park works because its amenity diversity score (48) is one of the city's strongest and its connectivity (78) is also top decile (7 distinct amenity types support different kinds of use).
What limits this park
Weston Lions Park's edges are fronted by border-vacuum land uses (highways, rail, parking, blank institutional), risk score 72.
Most distinctive characteristic
Most distinctive feature: exceptionally high amenity diversity (48, top decile).
Jacobs reading
Weston Lions Park sits between an urban social park and an ecological retreat: moderately useful for both, exceptionally suited to neither.
Tradeoffs
- Connectivity (78) significantly outpaces natural comfort (52): well placed in the city but offers little shade or ecological respite.
- The park is enclosed by buildings (69) but the surrounding streets are quiet (edge activation 0): frame without animation.
- High connectivity coexists with high border-vacuum risk (72): much of that connectivity is to highways, rail, or parking lots, not to neighbourhoods.
Performance in context
- A modest overperformer for its ravine / naturalized park typology (+7 vs the median in large Ravine / Naturalized Park ravine).
Typology classification
Classified as Ravine / Naturalized Park: 100% ravine overlap, 5% canopy. Secondary read: Athletic / Recreation Park (57% of amenity types are athletic (basketball, skatepark, sports_field, tennis)).
Edge Activation
Within 100 m of the park edge: 3 active uses (transit_stop) and 12 dead/hostile uses (parking_lot). Active edges keep "eyes on the park" through the day; parking lots, blank institutional walls, rail and highway frontages drain street life.
Source: OSM POIs (amenity/shop) + Toronto Building Footprints + land use
Connectivity
Connectivity blends paths, intersections, transit, entrances, and edge density. This park has 24 mapped paths/walkways and 60 sidewalk segments within 50 m; 14 street intersections within 100 m; 33 transit stops within a 400 m walk; 10 estimated access points across ~1,178 m of perimeter. moderate edge density, small superblock penalty applied. Source coverage: centreline, pedestrian_network, transit_osm.
Source: Toronto Centreline V2 + Pedestrian Network + OSM transit stops
Amenity Diversity
7 distinct amenity types in the park (basketball, community_centre, playground, skatepark, sports_field, tennis, …). Diversity, not raw count, drives the score so a park with many distinct activity types can outrank a larger park that repeats the same use.
Source: Toronto Parks & Recreation Facilities + OSM amenity tags
Natural Comfort
Natural-comfort components for this park: ~9.0% effective canopy (5.1% from contiguous tree polygons + scattered tree density); 100.0% inside the ravine system; 0.4% water surface; 96 city-mapped trees inside the polygon (12.9/ha). Reading: ravine-cooled. Source coverage: treed_area, ravine, waterbodies, street_trees. Impervious surface is approximated (Toronto's authoritative layer ships only as a raster GeoTIFF).
Source: Toronto Treed Area + Ravine + Waterbodies + Street Tree Inventory
Enclosure / Eyes on Park
76 buildings within 25 m of the park edge (6 mid-rise, 66 low-rise, 4 tower); avg edge height 8.4 m (~3 floors); 6.5 buildings per 100 m of 1,178 m perimeter (strong frontage density); edges are low-rise (mostly 2 to 3 floors); 4 towers ≥ 40 m within 25 m of the edge. "Eyes on the park" come strongest from the 6 mid-rise edge buildings.
Source: Toronto 3D Massing (building footprints + heights)
Border Vacuum Risk
Border-vacuum factors within 50 m of the park: parking_lot, parking_lot, parking_lot, parking_lot, parking_lot, parking_lot. Jacobs warned that highways, rail, parking lots and blank institutional edges act as "vacuums" that suppress foot traffic and isolate the park from its neighbourhood.
Source: Toronto Street Centreline (highways) + rail layer + OSM landuse + building footprints
Equity Context
Equity Context requires inputs not yet loaded for this park (Toronto Neighbourhood Profiles). Score is held at a neutral 50 with low confidence. Read with caution.
Source: Toronto Neighbourhood Profiles
Amenities (7 types · 7 records)
- basketball
- community centre
- playground
- skatepark
- sports field
- tennis
- washroom
Nearby active-edge features (80)
- parking lot0 m
- parking lot0 m
- parking lot0 m
- parking lot0 m
- parking lot0 m
- transit stop: Lawrence Ave West at Hickory Tree Rd8 m
- transit stop: Little Avenue25 m
- transit stop: Lawrence Ave West at Little Ave35 m
- parking lot45 m
- parking lot62 m
- parking lot72 m
- parking lot76 m
- parking lot83 m
- parking lot84 m
- parking lot90 m
- retail: Iman Varieties Store102 m
- retail: Brighten Cleaners104 m
- restaurant: Caribbean Queen Jerk106 m
- parking lot108 m
- parking lot112 m
- parking lot114 m
- retail: Weston Image Wear117 m
- transit stop: Lawrence Ave West at Weston Rd119 m
- parking lot119 m
- restaurant: Weston BBQ Restaurant126 m
- retail: KG Laundromat126 m
- parking lot127 m
- retail: Kedija Grocery Store128 m
- restaurant: Ali Baba's128 m
- restaurant: Durdur Grill128 m
- retail: Al-Baraka Variety Store128 m
- retail: Toga Tailor & Draperies129 m
- retail: D Empress Hair Salon129 m
- retail: Nancy129 m
- retail: Chief's Barber130 m
- retail: Ejabo Boutique & Beauty Salon130 m
- retail: Waryaa Covenience Store131 m
- retail: Kendale Cleaners132 m
- retail: Dzila Shalom Beauty Supply134 m
- retail: E's Discount134 m
- transit stop: Lawrence Ave West at Weston Rd West Side135 m
- retail: LW Hair Salon Unisex136 m
- retail: Just Supreme Beauty Centre136 m
- retail: Grace Ventures136 m
- retail: Lori Hair & Nail Salon137 m
- retail: Omely Nails138 m
- retail: Ayan Beauty Salon & Supply139 m
- parking lot: Visitor Free Parking139 m
- restaurant: Central Kafe Restaurant141 m
- parking lot141 m
- retail: C&D African143 m
- retail: Moonlight Dry Cleaners & Alterations145 m
- retail145 m
- transit stop: Lawrence Ave at Scarlett Rd145 m
- retail: Marilyn Beauty Supplies146 m
- retail: Clearance Depot151 m
- retail: Nicola Optical Boutique155 m
- retail: AR Dollar Express Plus155 m
- retail: 99c XPress158 m
- retail: Weston Shopping Centre158 m
- retail: Money Mart161 m
- transit stop: Weston Rd at Lawrence Ave West161 m
- restaurant: Made's Kitchen162 m
- parking lot163 m
- parking lot165 m
- retail: Karama Baby167 m
- parking lot167 m
- retail: Freedom Mobile167 m
- restaurant: Zeal Burgers169 m
- retail: Global Groceries Canada170 m
- transit stop: Weston Road170 m
- transit stop: Weston Rd at Lawrence Ave West170 m
- retail: Nutrition Mart Health Food171 m
- retail: Hashtag Wireless173 m
- retail: One Plus Optical175 m
- restaurant: Celebrity Chef176 m
- retail: Hilac Natural Beauty Products176 m
- restaurant: Wiff Restaurant177 m
- transit stop178 m
- retail: Muse Optical180 m
Park profile
Five-axis radar across the structural dimensions.
Citywide percentile ranks
Across all Toronto parks in the dataset.
- Overall vitality85th
- Edge activation46th
- Connectivity98th
- Amenity diversity100th
- Natural comfort64th
- Enclosure68th
Most similar parks
Closest in metric space across the five structural dimensions.
- Cedarvale ParkRavine / Naturalized Park45
- Tom Riley ParkWaterfront Park40
- Balmy Beach ParkWaterfront Park46
- Coronation Park - YorkRavine / Naturalized Park38
- Earlscourt ParkNeighbourhood Park44
Most opposite parks
Furthest in metric space. Useful for recognising what kind of park this isn’t.
- Simcoe ParkTower-Community Green Space51
- Queen'S Quay Traffic IslandWaterfront Park49
- Toronto Islands - Muggs Island ParkRavine / Naturalized Park25
- Trca Lands ( 26)Ravine / Naturalized Park27
- Manor Community GreenUrban Plaza57
Visitor signals
Public attention measured by Google Places aggregates. This proxies attention, not occupancy. Aggregate-only: no usernames, no review text, no extra photos beyond the cached hero.
p80 citywide · p78 within Ravine / Naturalized Park
Source: Google Places API · match medium (0.92 composite confidence) · last refreshed 5/9/2026. Privacy contract. Measures public attention, not occupancy.
Human activity signals: not available
No activity signals have landed for this park yet. The model has scored its physical form but it can’t yet say how often it’s programmed, photographed, or walked through. See /data-ethics for what we will and will not collect.
Does this score feel accurate?
Your read of Weston Lions Parkmatters. We’re testing whether the model lines up with how people actually use the park. Submissions are stored locally; no account needed.
Tell us how this park feels
We measure structure (canopy, edges, connectivity). You measure feeling. Both matter, and disagreement is itself useful civic data.
What would improve this park?
Generated from the weakest measured dimensions: a starting point, not a prescription.
- Activate the edges: encourage cafés, retail or community uses on the streets that face the park; replace blank or parking-lot edges where possible.
- Diversify what people can do in the park (playground, washroom, water, shade, performance, sport, garden): even small additions raise this score.
- Mitigate border vacuums (highways, rail, parking) with active programming on the still-permeable edges and treat the hostile edge as a design challenge.
Data sources
- City of Toronto Open Data: Parks (Green Space)Polygon boundaries, official names, types.
- Parks & Recreation FacilitiesInventory of in-park amenities (washrooms, fields, rinks…).
- Toronto Pedestrian NetworkSidewalk segments around and through parks; estimated park entrances.
- Toronto Centreline V2Street segments + intersection nodes near park edges; trails and walkways.
- Toronto 3D MassingBuilding footprints + heights for edge-building counts, frontage density, and tower-in-the-park risk.
- Toronto Treed AreaTree canopy share inside park polygons via stratified-grid sampling.
- Toronto Waterbodies & RiversWater surface inside parks + nearest-water distance for cooling.
- Ravine & Natural Feature ProtectionRavine overlap as a cooling / natural-comfort signal.
- Toronto Street Tree InventoryTree count + density inside park polygons.
- Neighbourhood Profiles(Pending) Equity context proxy.
- OpenStreetMap (Overpass API)Cafés, restaurants, retail, transit stops, parking, highways, rail.