Tom Riley Park
Waterfront Park, above average overall (score 40, rank ~75th percentile). Strongest: connectivity; weakest: edge activation.
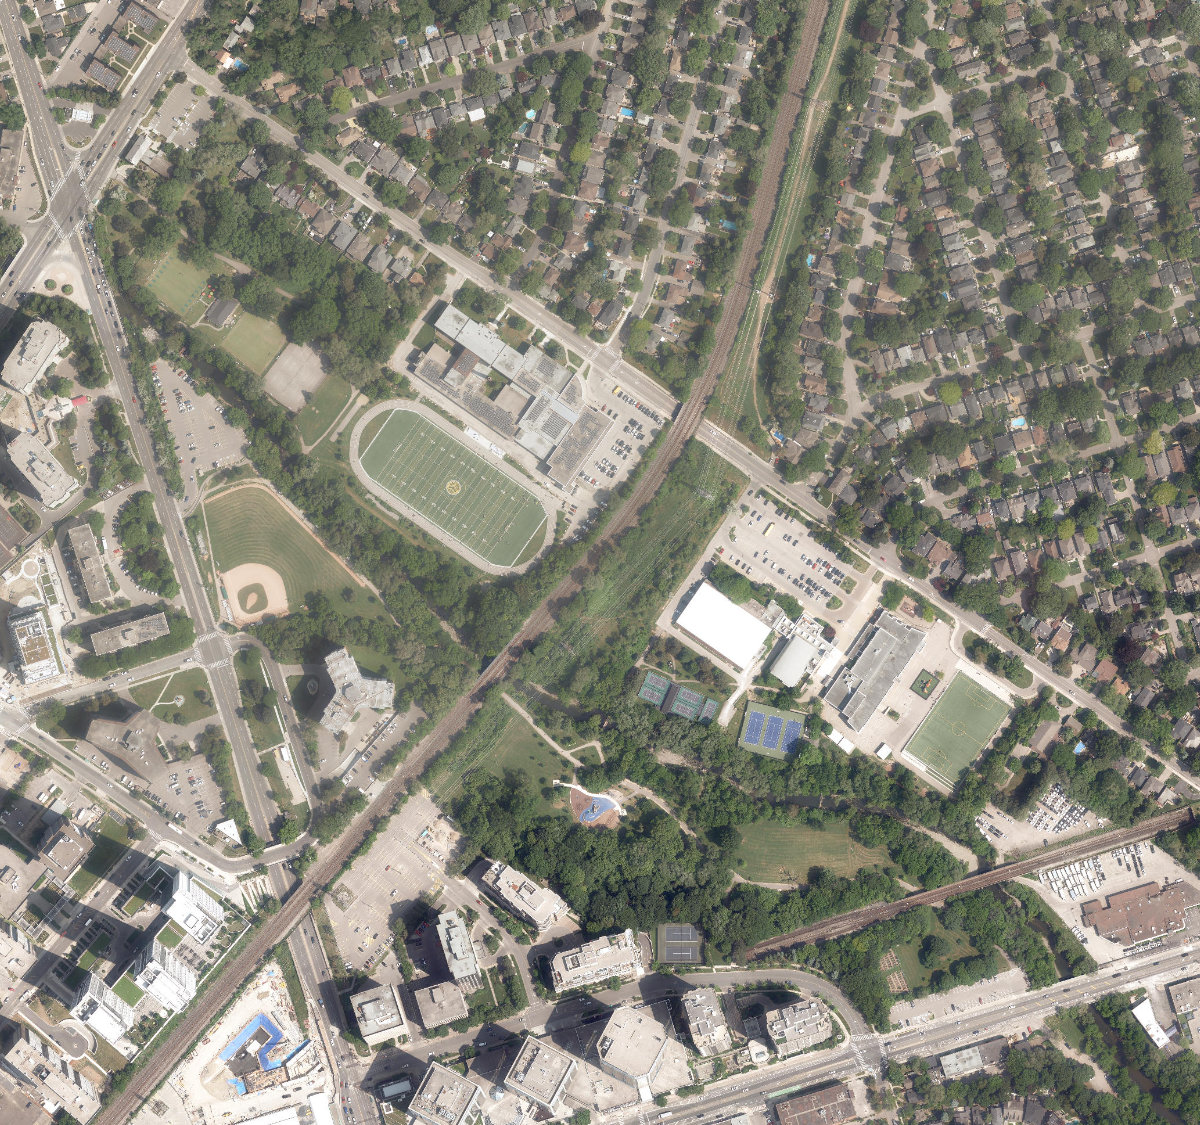
Aerial, City of Toronto orthophoto, ~8 cm/px source · cached 5/9/2026
Tom Riley Park scores 40 / 100. Strongest dimensions: connectivity and enclosure / eyes on park. Weakest: edge activation (0). Border-vacuum risk is elevated (100). This score is a transparent reading of Jane Jacobs-style vitality factors, not a definitive judgment.
Area · 14.86 ha
Weighted across six dimensions · confidence 72%
Scores are not bell-curved. Percentiles and expected scores provide context without changing the underlying model.
Loading map…
The parks map is loading.Explain this score
Where did the 40 come from? Each weighted contribution against a neutral 50 baseline. Green = pushed up; red = pulled down.
Sum of contributions = the headline score. A negative bar means that dimension dragged the park below the city-wide neutral baseline.
Why this park works
Tom Riley Park works because its connectivity score (83) is one of the city's strongest and its amenity diversity (40) is also top decile (46 transit stops sit within a 400 m walk; 32 intersections fall within 100 m of the edge).
What limits this park
Tom Riley Park is held back by edge activation (0, below-average): the surrounding streets carry too few active uses to spill into the park; border-vacuum risk is also elevated (100).
Most distinctive characteristic
Most distinctive feature: exceptionally high connectivity (83, top decile).
Jacobs reading
Tom Riley Park sits between an urban social park and an ecological retreat: moderately useful for both, exceptionally suited to neither.
Tradeoffs
- Connectivity (83) significantly outpaces natural comfort (56): well placed in the city but offers little shade or ecological respite.
- The park is enclosed by buildings (72) but the surrounding streets are quiet (edge activation 0): frame without animation.
- High connectivity coexists with high border-vacuum risk (100): much of that connectivity is to highways, rail, or parking lots, not to neighbourhoods.
Typology classification
Classified as Waterfront Park: 7% water surface inside park. Secondary read: Ravine / Naturalized Park (81% ravine overlap, 8% canopy).
Edge Activation
Within 100 m of the park edge: 25 active uses (transit_stop, retail, restaurant) and 55 dead/hostile uses (rail, parking_lot, highway). Active edges keep "eyes on the park" through the day; parking lots, blank institutional walls, rail and highway frontages drain street life.
Source: OSM POIs (amenity/shop) + Toronto Building Footprints + land use
Connectivity
Connectivity blends paths, intersections, transit, entrances, and edge density. This park has 45 mapped paths/walkways and 83 sidewalk segments within 50 m; 32 street intersections within 100 m; 46 transit stops within a 400 m walk; 26 estimated access points across ~3,167 m of perimeter. moderate edge density, small superblock penalty applied. Source coverage: centreline, pedestrian_network, transit_osm.
Source: Toronto Centreline V2 + Pedestrian Network + OSM transit stops
Amenity Diversity
5 distinct amenity types in the park (community_centre, playground, sports_field, tennis, washroom). Diversity, not raw count, drives the score so a park with many distinct activity types can outrank a larger park that repeats the same use.
Source: Toronto Parks & Recreation Facilities + OSM amenity tags
Natural Comfort
Natural-comfort components for this park: 7.9% estimated tree canopy; 81.2% inside the ravine system; 7.3% water surface; 176 city-mapped trees inside the polygon (11.8/ha). Reading: ravine-cooled. Source coverage: treed_area, ravine, waterbodies, street_trees. Impervious surface is approximated (Toronto's authoritative layer ships only as a raster GeoTIFF).
Source: Toronto Treed Area + Ravine + Waterbodies + Street Tree Inventory
Enclosure / Eyes on Park
122 buildings within 25 m of the park edge (17 mid-rise, 89 low-rise, 16 tower); avg edge height 14.8 m (~5 floors); 3.9 buildings per 100 m of 3,167 m perimeter (strong frontage density); edges are at a Jacobs-scale walkable mid-rise (3 to 7 floors); 16 towers ≥ 40 m within 25 m of the edge. "Eyes on the park" come strongest from the 17 mid-rise edge buildings.
Source: Toronto 3D Massing (building footprints + heights)
Border Vacuum Risk
Border-vacuum factors within 50 m of the park: Galt Subdivision, Galt Subdivision, Galt Subdivision, parking_lot, parking_lot, Galt Subdivision, Galt Subdivision, Galt Subdivision, Galt Subdivision, Galt Subdivision, Galt Subdivision, Galt Subdivision, Galt Subdivision, Galt Subdivision, parking_lot, parking_lot, Bloor-Danforth Line, Bloor-Danforth Line, Galt Subdivision, Galt Subdivision, Galt Subdivision, parking_lot, parking_lot, Bloor-Danforth Line, Bloor-Danforth Line, Bloor Street West, Bloor Street West, Bloor Street West, Bloor-Danforth Line, Bloor-Danforth Line, Central Park, parking_lot, rail, rail, Bloor-Danforth Line, Bloor Street West, Bloor Street West, Humberview Chevrolet Car Storage. Jacobs warned that highways, rail, parking lots and blank institutional edges act as "vacuums" that suppress foot traffic and isolate the park from its neighbourhood.
Source: Toronto Street Centreline (highways) + rail layer + OSM landuse + building footprints
Equity Context
Equity Context requires inputs not yet loaded for this park (Toronto Neighbourhood Profiles). Score is held at a neutral 50 with low confidence. Read with caution.
Source: Toronto Neighbourhood Profiles
Amenities (5 types · 6 records)
- community centre
- playground
- sports field
- tennis
- washroom
Nearby active-edge features (80)
- retail: Tennis Club0 m
- parking lot0 m
- parking lot0 m
- rail: Bloor-Danforth Line0 m
- rail: Bloor-Danforth Line0 m
- parking lot: Central Park0 m
- parking lot0 m
- transit stop: Cordova Avenue3 m
- transit stop3 m
- transit stop: Islington Avenue3 m
- parking lot4 m
- rail: Bloor-Danforth Line4 m
- transit stop5 m
- transit stop: Dundas Street West6 m
- rail6 m
- rail: Galt Subdivision7 m
- rail: Galt Subdivision7 m
- rail: Bloor-Danforth Line7 m
- transit stop8 m
- rail: Bloor-Danforth Line9 m
- rail9 m
- rail: Galt Subdivision10 m
- rail: Galt Subdivision10 m
- rail: Galt Subdivision10 m
- rail: Galt Subdivision11 m
- highway: Bloor Street West13 m
- highway: Bloor Street West13 m
- highway: Bloor Street West14 m
- rail: Galt Subdivision14 m
- rail: Galt Subdivision15 m
- rail: Bloor-Danforth Line16 m
- rail: Galt Subdivision18 m
- rail: Bloor-Danforth Line23 m
- rail: Galt Subdivision23 m
- rail: Galt Subdivision24 m
- rail: Galt Subdivision24 m
- rail: Galt Subdivision25 m
- rail: Galt Subdivision26 m
- transit stop: Islington Avenue28 m
- rail: Galt Subdivision28 m
- transit stop: Central Park Roadway at Islington Ave29 m
- transit stop: 1300 Islington Avenue29 m
- retail: Beautique Spa & Laser Inc.36 m
- parking lot37 m
- retail: iLux Beauty38 m
- parking lot: Humberview Chevrolet Car Storage40 m
- transit stop: Central Park Roadway South Side41 m
- transit stop: Islington Ave at Dundas St W42 m
- parking lot43 m
- highway: Bloor Street West45 m
- highway: Bloor Street West47 m
- parking lot49 m
- parking lot51 m
- parking lot52 m
- rail: Bloor-Danforth Line56 m
- parking lot58 m
- parking lot61 m
- parking lot: Humberview Chevrolet Car Storage66 m
- rail: Bloor-Danforth Line67 m
- rail: Bloor-Danforth Line69 m
- parking lot: TTC commuter parking TPA 80470 m
- parking lot70 m
- retail: Skin Care Clinic72 m
- transit stop: 50 Cordova Avenue73 m
- transit stop: Cordova Avenue74 m
- parking lot74 m
- parking lot78 m
- restaurant: Big Slice Kitchen80 m
- transit stop84 m
- restaurant: Papa John's86 m
- retail: Montgomery Alterations & Drycleaning87 m
- parking lot87 m
- highway: Bloor Street West89 m
- parking lot91 m
- parking lot: Canada Wide Parking93 m
- restaurant: Bens The Greek94 m
- restaurant: Pumpernickel’s95 m
- restaurant: Captain Azza96 m
- restaurant: Ali Baba’s96 m
- parking lot98 m
Park profile
Five-axis radar across the structural dimensions.
Citywide percentile ranks
Across all Toronto parks in the dataset.
- Overall vitality75th
- Edge activation31th
- Connectivity99th
- Amenity diversity99th
- Natural comfort69th
- Enclosure72th
Most similar parks
Closest in metric space across the five structural dimensions.
- Balmy Beach ParkWaterfront Park46
- Riverdale Park WestRavine / Naturalized Park46
- Cedarvale ParkRavine / Naturalized Park45
- Mccormick ParkAthletic / Recreation Park46
- Coronation Park - YorkRavine / Naturalized Park38
Most opposite parks
Furthest in metric space. Useful for recognising what kind of park this isn’t.
- Simcoe ParkTower-Community Green Space51
- Toronto Islands - Muggs Island ParkRavine / Naturalized Park25
- Trca Lands ( 26)Ravine / Naturalized Park27
- Queen'S Quay Traffic IslandWaterfront Park49
- Rouge ParkRavine / Naturalized Park21
Human activity signals: not available
No activity signals have landed for this park yet. The model has scored its physical form but it can’t yet say how often it’s programmed, photographed, or walked through. See /data-ethics for what we will and will not collect.
Does this score feel accurate?
Your read of Tom Riley Parkmatters. We’re testing whether the model lines up with how people actually use the park. Submissions are stored locally; no account needed.
Tell us how this park feels
We measure structure (canopy, edges, connectivity). You measure feeling. Both matter, and disagreement is itself useful civic data.
What would improve this park?
Generated from the weakest measured dimensions: a starting point, not a prescription.
- Activate the edges: encourage cafés, retail or community uses on the streets that face the park; replace blank or parking-lot edges where possible.
- Diversify what people can do in the park (playground, washroom, water, shade, performance, sport, garden): even small additions raise this score.
- Mitigate border vacuums (highways, rail, parking) with active programming on the still-permeable edges and treat the hostile edge as a design challenge.
Data sources
- City of Toronto Open Data: Parks (Green Space)Polygon boundaries, official names, types.
- Parks & Recreation FacilitiesInventory of in-park amenities (washrooms, fields, rinks…).
- Toronto Pedestrian NetworkSidewalk segments around and through parks; estimated park entrances.
- Toronto Centreline V2Street segments + intersection nodes near park edges; trails and walkways.
- Toronto 3D MassingBuilding footprints + heights for edge-building counts, frontage density, and tower-in-the-park risk.
- Toronto Treed AreaTree canopy share inside park polygons via stratified-grid sampling.
- Toronto Waterbodies & RiversWater surface inside parks + nearest-water distance for cooling.
- Ravine & Natural Feature ProtectionRavine overlap as a cooling / natural-comfort signal.
- Toronto Street Tree InventoryTree count + density inside park polygons.
- Neighbourhood Profiles(Pending) Equity context proxy.
- OpenStreetMap (Overpass API)Cafés, restaurants, retail, transit stops, parking, highways, rail.