Doris - Norton Park
Tower-Community Green Space, middle of the pack overall (score 36, rank ~57th percentile). Strongest: enclosure; weakest: natural comfort.
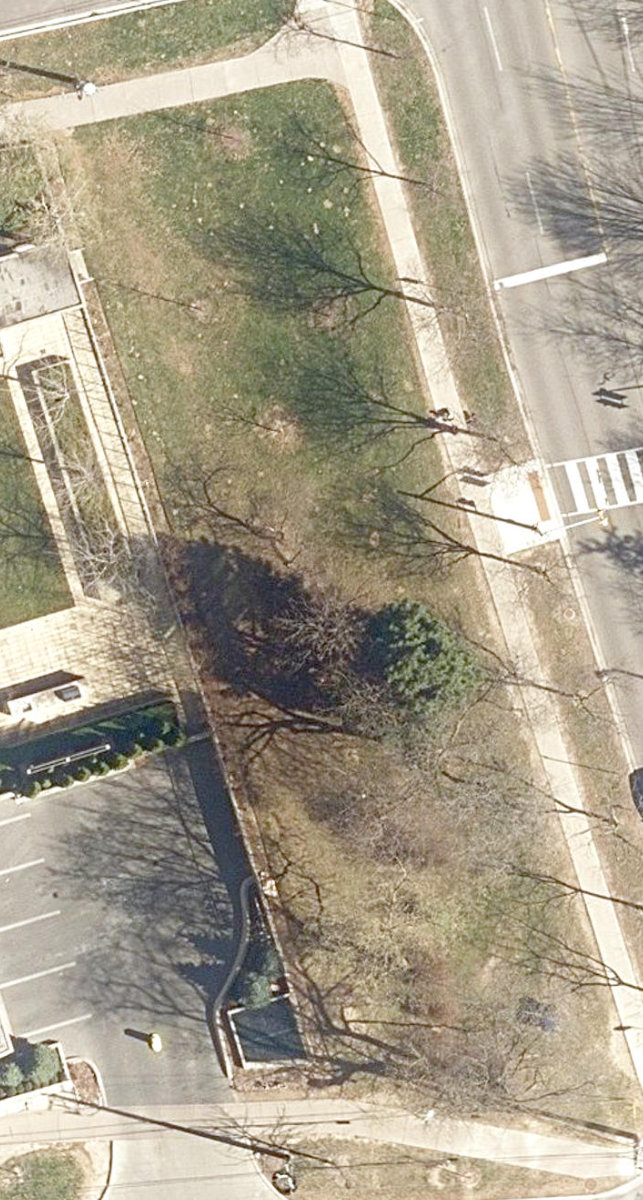
Aerial, City of Toronto orthophoto, ~8 cm/px source · cached 5/9/2026
Doris - Norton Park scores 35.6 / 100. Strongest dimensions: enclosure / eyes on park and connectivity. Weakest: amenity diversity (0). Border-vacuum risk is low. This score is a transparent reading of Jane Jacobs-style vitality factors, not a definitive judgment.
Area · 0.10 ha
Weighted across six dimensions · confidence 57%
Scores are not bell-curved. Percentiles and expected scores provide context without changing the underlying model.
Loading map…
The parks map is loading.Explain this score
Where did the 36 come from? Each weighted contribution against a neutral 50 baseline. Green = pushed up; red = pulled down.
Sum of contributions = the headline score. A negative bar means that dimension dragged the park below the city-wide neutral baseline.
Why this park works
Doris - Norton Park works because its enclosure score (80) is above average and its connectivity (59) is also above-average (3 mid-rise buildings frame the edge with passive surveillance).
What limits this park
Doris - Norton Park doesn't have a clear weakness. Every measured dimension is at or above the middle of the pack.
Most distinctive characteristic
Most distinctive feature: exceptionally high enclosure (80, top quartile).
Jacobs reading
Doris - Norton Park sits between an urban social park and an ecological retreat: moderately useful for both, exceptionally suited to neither.
Tradeoffs
- The park is enclosed by buildings (80) but the surrounding streets are quiet (edge activation 0): frame without animation.
- 8 nearby towers cast wind and shadow without contributing canopy: passive surveillance is plentiful but human-scale comfort is not.
Typology classification
Classified as Tower-Community Green Space: 8 towers vs 3 mid-rise within 25 m on a 0.1 ha park. Secondary read: Urban Plaza (950 m², paved (0% canopy), 15.5 buildings/100 m).
Edge Activation
Within 100 m of the park edge: 10 active uses (transit_stop, retail, restaurant) and 9 dead/hostile uses (highway, parking_lot). Active edges keep "eyes on the park" through the day; parking lots, blank institutional walls, rail and highway frontages drain street life.
Source: OSM POIs (amenity/shop) + Toronto Building Footprints + land use
Connectivity
Connectivity blends paths, intersections, transit, entrances, and edge density. This park has 1 mapped paths/walkways and 20 sidewalk segments within 50 m; 12 street intersections within 100 m; 9 transit stops within a 400 m walk; 0 estimated access points across ~149 m of perimeter. edge density is healthy, no superblock penalty. Source coverage: centreline, pedestrian_network, transit_osm.
Source: Toronto Centreline V2 + Pedestrian Network + OSM transit stops
Amenity Diversity
No amenities recorded. Score is 0 until inventory is loaded.
Source: Toronto Parks & Recreation Facilities + OSM amenity tags
Natural Comfort
Natural-comfort components for this park: ~7.7% effective canopy (0.0% from contiguous tree polygons + scattered tree density); nearest waterbody ~1495 m; 11 city-mapped trees inside the polygon (11.0/ha). Reading: exposed. Source coverage: waterbodies, street_trees. Impervious surface is approximated (Toronto's authoritative layer ships only as a raster GeoTIFF).
Source: Toronto Treed Area + Ravine + Waterbodies + Street Tree Inventory
Enclosure / Eyes on Park
23 buildings within 25 m of the park edge (3 mid-rise, 12 low-rise, 8 tower); avg edge height 20.4 m (~7 floors); 15.5 buildings per 100 m of 149 m perimeter (strong frontage density); edges are at a Jacobs-scale walkable mid-rise (3 to 7 floors); 8 towers ≥ 40 m within 25 m of the edge. "Eyes on the park" come strongest from the 3 mid-rise edge buildings.
Source: Toronto 3D Massing (building footprints + heights)
Border Vacuum Risk
Park edges face the city. No significant border vacuum detected.
Source: Toronto Street Centreline (highways) + rail layer + OSM landuse + building footprints
Equity Context
Equity Context requires inputs not yet loaded for this park (Toronto Neighbourhood Profiles). Score is held at a neutral 50 with low confidence. Read with caution.
Source: Toronto Neighbourhood Profiles
Amenities (0)
No amenities recorded for this park.
Nearby active-edge features (54)
- parking lot60 m
- retail: 依 e's Beauty Studio61 m
- retail: sis² by Love65 m
- restaurant: Pho Dac Biet66 m
- restaurant: Yunshang Rice Noodle67 m
- restaurant: Yang's Braised Chicken Rice67 m
- parking lot68 m
- retail: Garden Hairdressing69 m
- retail: Unicorn Pâtisserie & Lounge69 m
- parking lot70 m
- restaurant: 43° N BBQ Bar71 m
- parking lot72 m
- retail: H2 Nails & Spa76 m
- parking lot76 m
- parking lot78 m
- parking lot: Parking for H Mart85 m
- parking lot86 m
- transit stop: Yonge Street at Norton Avenue89 m
- highway: Yonge Street97 m
- retail103 m
- restaurant: Kim’s A La Cart109 m
- restaurant: San Tong109 m
- transit stop: Yonge Street at Church Avenue110 m
- restaurant: DakGoGi110 m
- restaurant: Oh Geul Boh Geul Korean Restaurant113 m
- retail: The Printing House113 m
- parking lot114 m
- transit stop: Yonge Street at Ellerslie Avenue116 m
- retail: I Cosmetic119 m
- retail: Haiwai Travel120 m
- retail: Hair I Am Studio122 m
- parking lot124 m
- retail: Wine Rack126 m
- restaurant: Hot Impression128 m
- retail: N Hair Salon129 m
- cafe: Tim Hortons131 m
- retail: The OWL’s Meat Shop133 m
- restaurant: Superhot137 m
- restaurant: Ajisen Ramen138 m
- retail: Koko Hair Salon139 m
- cafe: Royaltea141 m
- restaurant: Subway144 m
- highway: Yonge Street147 m
- retail: La La Wellness Centre153 m
- retail: Danmi Nails & Brows156 m
- parking lot156 m
- transit stop: Yonge Street at Churchill Avenue157 m
- transit stop: Yonge St. @ Churchill Ave.159 m
- parking lot160 m
- parking lot160 m
- restaurant: Evivva Restaurant Breakfast & Lunch161 m
- parking lot189 m
- parking lot192 m
- parking lot195 m
Park profile
Five-axis radar across the structural dimensions.
Citywide percentile ranks
Across all Toronto parks in the dataset.
- Overall vitality57th
- Edge activation44th
- Connectivity71th
- Amenity diversity50th
- Natural comfort37th
- Enclosure83th
Most similar parks
Closest in metric space across the five structural dimensions.
- PARKDALE HEALTH CENTRE - Building GroundsUrban Plaza33
- Kildonan ParkUrban Plaza35
- George Ben ParkParkette36
- North York Hydro Green SpaceNeighbourhood Park33
- Coe Hill Drive ParketteUrban Plaza30
Most opposite parks
Furthest in metric space. Useful for recognising what kind of park this isn’t.
- Kew GardensNeighbourhood Park71
- Leslie Grove ParkParkette68
- Trca Lands ( 26)Ravine / Naturalized Park27
- Mclevin Woods ParkRavine / Naturalized Park49
- Toronto Islands - Island ParkWaterfront Park52
Human activity signals: not available
No activity signals have landed for this park yet. The model has scored its physical form but it can’t yet say how often it’s programmed, photographed, or walked through. See /data-ethics for what we will and will not collect.
Does this score feel accurate?
Your read of Doris - Norton Parkmatters. We’re testing whether the model lines up with how people actually use the park. Submissions are stored locally; no account needed.
Tell us how this park feels
We measure structure (canopy, edges, connectivity). You measure feeling. Both matter, and disagreement is itself useful civic data.
What would improve this park?
Generated from the weakest measured dimensions: a starting point, not a prescription.
- Activate the edges: encourage cafés, retail or community uses on the streets that face the park; replace blank or parking-lot edges where possible.
- Diversify what people can do in the park (playground, washroom, water, shade, performance, sport, garden): even small additions raise this score.
- Increase canopy and reduce paved area. Shade and water features extend usable hours and seasons.
Data sources
- City of Toronto Open Data: Parks (Green Space)Polygon boundaries, official names, types.
- Parks & Recreation FacilitiesInventory of in-park amenities (washrooms, fields, rinks…).
- Toronto Pedestrian NetworkSidewalk segments around and through parks; estimated park entrances.
- Toronto Centreline V2Street segments + intersection nodes near park edges; trails and walkways.
- Toronto 3D MassingBuilding footprints + heights for edge-building counts, frontage density, and tower-in-the-park risk.
- Toronto Treed AreaTree canopy share inside park polygons via stratified-grid sampling.
- Toronto Waterbodies & RiversWater surface inside parks + nearest-water distance for cooling.
- Ravine & Natural Feature ProtectionRavine overlap as a cooling / natural-comfort signal.
- Toronto Street Tree InventoryTree count + density inside park polygons.
- Neighbourhood Profiles(Pending) Equity context proxy.
- OpenStreetMap (Overpass API)Cafés, restaurants, retail, transit stops, parking, highways, rail.