Beth Tzedec Memorial Park
Neighbourhood Park, below average overall (score 30, rank ~30th percentile). Strongest: connectivity; weakest: edge activation.
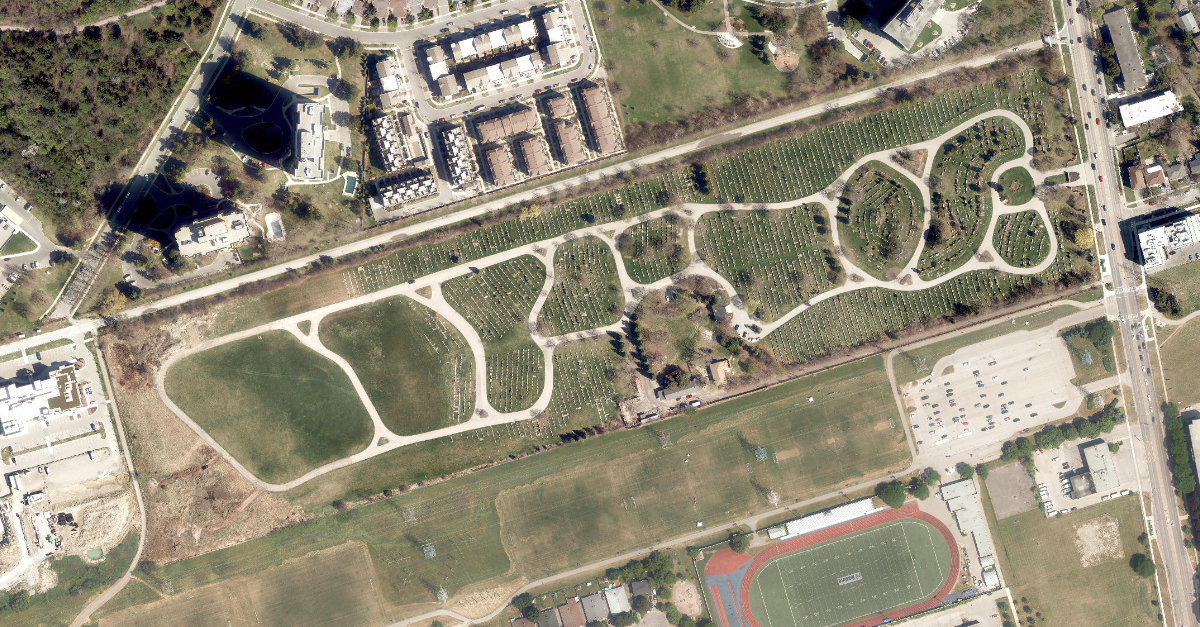
Aerial, City of Toronto orthophoto, ~8 cm/px source · cached 5/9/2026
Beth Tzedec Memorial Park scores 29.9 / 100. Strongest dimensions: enclosure / eyes on park and connectivity. Weakest: amenity diversity (0). Border-vacuum risk is low. This score is a transparent reading of Jane Jacobs-style vitality factors, not a definitive judgment.
Area · 13.96 ha
Weighted across six dimensions · confidence 63%
Scores are not bell-curved. Percentiles and expected scores provide context without changing the underlying model.
Loading map…
The parks map is loading.Explain this score
Where did the 30 come from? Each weighted contribution against a neutral 50 baseline. Green = pushed up; red = pulled down.
Sum of contributions = the headline score. A negative bar means that dimension dragged the park below the city-wide neutral baseline.
Why this park works
Beth Tzedec Memorial Park doesn't have a clear standout dimension. The strongest measured signal is connectivity, and even that is below the city median.
What limits this park
Beth Tzedec Memorial Park is held back by edge activation (0, bottom quartile): the surrounding streets carry too few active uses to spill into the park.
Most distinctive characteristic
Most distinctive feature: exceptionally low edge activation (0, bottom quartile).
Jacobs reading
Beth Tzedec Memorial Park sits between an urban social park and an ecological retreat: moderately useful for both, exceptionally suited to neither.
Tradeoffs
- The park is enclosed by buildings (61) but the surrounding streets are quiet (edge activation 0): frame without animation.
- 5 nearby towers cast wind and shadow without contributing canopy: passive surveillance is plentiful but human-scale comfort is not.
Typology classification
Classified as Neighbourhood Park: 14.0 ha, framed by 16 mid-rise vs 5 towers. Secondary read: Waterfront Park (nearest waterbody within ~80 m).
Edge Activation
Within 100 m of the park edge: 6 active uses (transit_stop, retail) and 7 dead/hostile uses (parking_lot). Active edges keep "eyes on the park" through the day; parking lots, blank institutional walls, rail and highway frontages drain street life.
Source: OSM POIs (amenity/shop) + Toronto Building Footprints + land use
Connectivity
Connectivity blends paths, intersections, transit, entrances, and edge density. This park has 4 mapped paths/walkways and 17 sidewalk segments within 50 m; 6 street intersections within 100 m; 16 transit stops within a 400 m walk; 0 estimated access points across ~1,924 m of perimeter. low edge density, significant superblock penalty applied. Source coverage: centreline, pedestrian_network, transit_osm.
Source: Toronto Centreline V2 + Pedestrian Network + OSM transit stops
Amenity Diversity
No amenities recorded. Score is 0 until inventory is loaded.
Source: Toronto Parks & Recreation Facilities + OSM amenity tags
Natural Comfort
Natural-comfort components for this park: 3.3% estimated tree canopy; nearest waterbody ~80 m. Reading: water-cooled. Source coverage: treed_area, waterbodies. Impervious surface is approximated (Toronto's authoritative layer ships only as a raster GeoTIFF).
Source: Toronto Treed Area + Ravine + Waterbodies + Street Tree Inventory
Enclosure / Eyes on Park
37 buildings within 25 m of the park edge (16 mid-rise, 16 low-rise, 5 tower); avg edge height 20.2 m (~7 floors); 1.9 buildings per 100 m of 1,924 m perimeter (moderate frontage density); edges are at a Jacobs-scale walkable mid-rise (3 to 7 floors); 5 towers ≥ 40 m within 25 m of the edge. "Eyes on the park" come strongest from the 16 mid-rise edge buildings.
Source: Toronto 3D Massing (building footprints + heights)
Border Vacuum Risk
Border-vacuum factors within 50 m of the park: parking_lot, parking_lot. Jacobs warned that highways, rail, parking lots and blank institutional edges act as "vacuums" that suppress foot traffic and isolate the park from its neighbourhood.
Source: Toronto Street Centreline (highways) + rail layer + OSM landuse + building footprints
Equity Context
Equity Context requires inputs not yet loaded for this park (Toronto Neighbourhood Profiles). Score is held at a neutral 50 with low confidence. Read with caution.
Source: Toronto Neighbourhood Profiles
Amenities (0)
No amenities recorded for this park.
Nearby active-edge features (31)
- transit stop: 5720 Bathurst Street7 m
- parking lot43 m
- transit stop: Opposite 5720 Bathurst Street45 m
- parking lot45 m
- parking lot57 m
- retail73 m
- parking lot74 m
- parking lot75 m
- retail75 m
- parking lot80 m
- parking lot91 m
- retail: Autopro Bathurst Car Care93 m
- transit stop: Drewry Avenue Opposite 100 Antibes Drive96 m
- retail: 'Convenience Store'112 m
- parking lot112 m
- retail117 m
- parking lot129 m
- parking lot132 m
- parking lot141 m
- transit stop: Antibes Drive at Candle Liteway148 m
- parking lot151 m
- parking lot153 m
- parking lot163 m
- parking lot168 m
- transit stop: Antibes Drive at Torresdale Ave179 m
- transit stop: Bathurst Street at Drewry Avenue184 m
- parking lot189 m
- parking lot189 m
- transit stop: Opposite 4981 Bathurst Street195 m
- transit stop: Antibes Drive at Bathurst Street195 m
- cafe: Tim Hortons195 m
Park profile
Five-axis radar across the structural dimensions.
Citywide percentile ranks
Across all Toronto parks in the dataset.
- Overall vitality30th
- Edge activation8th
- Connectivity56th
- Amenity diversity13th
- Natural comfort40th
- Enclosure37th
Most similar parks
Closest in metric space across the five structural dimensions.
- Scarborough Hydro Green SpaceParkette29
- City Wide Open SpaceNeighbourhood Park32
- Public Access PropertyCorridor / Linear Park33
- Scarborough Hydro Green SpaceNeighbourhood Park32
- Highland Memory GardensNeighbourhood Park22
Most opposite parks
Furthest in metric space. Useful for recognising what kind of park this isn’t.
- Kew GardensNeighbourhood Park71
- Leslie Grove ParkParkette68
- Market Lane ParkUrban Plaza63
- Bellevue Square ParkCivic Square66
- ALEX WILSON COMMUNITY GARDEN - Open Green SpaceUrban Plaza59
Human activity signals: not available
No activity signals have landed for this park yet. The model has scored its physical form but it can’t yet say how often it’s programmed, photographed, or walked through. See /data-ethics for what we will and will not collect.
Does this score feel accurate?
Your read of Beth Tzedec Memorial Parkmatters. We’re testing whether the model lines up with how people actually use the park. Submissions are stored locally; no account needed.
Tell us how this park feels
We measure structure (canopy, edges, connectivity). You measure feeling. Both matter, and disagreement is itself useful civic data.
What would improve this park?
Generated from the weakest measured dimensions: a starting point, not a prescription.
- Activate the edges: encourage cafés, retail or community uses on the streets that face the park; replace blank or parking-lot edges where possible.
- Diversify what people can do in the park (playground, washroom, water, shade, performance, sport, garden): even small additions raise this score.
- Increase canopy and reduce paved area. Shade and water features extend usable hours and seasons.
Data sources
- City of Toronto Open Data: Parks (Green Space)Polygon boundaries, official names, types.
- Parks & Recreation FacilitiesInventory of in-park amenities (washrooms, fields, rinks…).
- Toronto Pedestrian NetworkSidewalk segments around and through parks; estimated park entrances.
- Toronto Centreline V2Street segments + intersection nodes near park edges; trails and walkways.
- Toronto 3D MassingBuilding footprints + heights for edge-building counts, frontage density, and tower-in-the-park risk.
- Toronto Treed AreaTree canopy share inside park polygons via stratified-grid sampling.
- Toronto Waterbodies & RiversWater surface inside parks + nearest-water distance for cooling.
- Ravine & Natural Feature ProtectionRavine overlap as a cooling / natural-comfort signal.
- Toronto Street Tree InventoryTree count + density inside park polygons.
- Neighbourhood Profiles(Pending) Equity context proxy.
- OpenStreetMap (Overpass API)Cafés, restaurants, retail, transit stops, parking, highways, rail.