Etobicoke Hydro Green Space
Other, below average overall (score 30, rank ~29th percentile). Strongest: edge activation; weakest: enclosure.
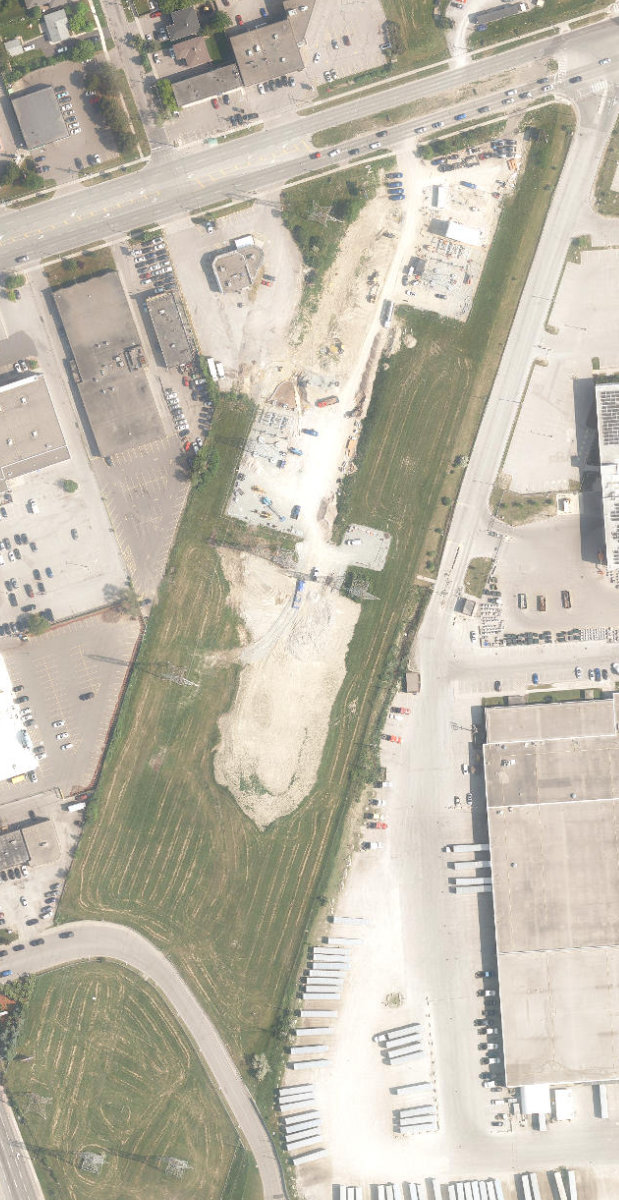
Aerial, City of Toronto orthophoto, ~8 cm/px source · cached 5/9/2026
Etobicoke Hydro Green Space scores 29.7 / 100. Strongest dimensions: enclosure / eyes on park and connectivity. Weakest: amenity diversity (0). Border-vacuum risk is low. This score is a transparent reading of Jane Jacobs-style vitality factors, not a definitive judgment.
Area · 4.09 ha
Weighted across six dimensions · confidence 63%
Scores are not bell-curved. Percentiles and expected scores provide context without changing the underlying model.
Loading map…
The parks map is loading.Explain this score
Where did the 30 come from? Each weighted contribution against a neutral 50 baseline. Green = pushed up; red = pulled down.
Sum of contributions = the headline score. A negative bar means that dimension dragged the park below the city-wide neutral baseline.
Why this park works
Etobicoke Hydro Green Space works because its edge activation score (28) is in the top tier and its amenity diversity (0) is also above-average.
What limits this park
Etobicoke Hydro Green Space is held back by enclosure (34, bottom quartile): no mid-rise frontage to provide eyes on the park.
Most distinctive characteristic
Most distinctive feature: exceptionally low enclosure (34, bottom quartile).
Jacobs reading
Etobicoke Hydro Green Space is currently underperforming on both axes: neither integrated into the city nor offering deep natural respite. A candidate for design intervention.
Performance in context
- Although its citywide rank is low (29th), it ranks highly among similar others (71st): strong for what it is, even if the absolute score is moderate.
Typology classification
Classified as Other: does not meet any specific typology threshold (4.1 ha, 0 amenity types, frontage 1.0/100m)
Edge Activation
Within 100 m of the park edge: 13 active uses (transit_stop, retail, restaurant, community) and 5 dead/hostile uses (parking_lot). Active edges keep "eyes on the park" through the day; parking lots, blank institutional walls, rail and highway frontages drain street life.
Source: OSM POIs (amenity/shop) + Toronto Building Footprints + land use
Connectivity
Connectivity blends paths, intersections, transit, entrances, and edge density. This park has 0 mapped paths/walkways and 5 sidewalk segments within 50 m; 3 street intersections within 100 m; 11 transit stops within a 400 m walk; 0 estimated access points across ~1,061 m of perimeter. low edge density, significant superblock penalty applied. Source coverage: centreline, pedestrian_network, transit_osm.
Source: Toronto Centreline V2 + Pedestrian Network + OSM transit stops
Amenity Diversity
No amenities recorded. Score is 0 until inventory is loaded.
Source: Toronto Parks & Recreation Facilities + OSM amenity tags
Natural Comfort
Natural-comfort components for this park: 0.6% estimated tree canopy; nearest waterbody ~1135 m. Reading: exposed. Source coverage: treed_area, waterbodies. Impervious surface is approximated (Toronto's authoritative layer ships only as a raster GeoTIFF).
Source: Toronto Treed Area + Ravine + Waterbodies + Street Tree Inventory
Enclosure / Eyes on Park
11 buildings within 25 m of the park edge (0 mid-rise, 11 low-rise, 0 tower); avg edge height 4.9 m (~2 floors); 1.0 buildings per 100 m of 1,061 m perimeter (thin frontage with significant blank-edge share); edges are barely there or single-storey; no towers immediately adjacent. "Eyes on the park" come strongest from the 0 mid-rise edge buildings.
Source: Toronto 3D Massing (building footprints + heights)
Border Vacuum Risk
Border-vacuum factors within 50 m of the park: parking_lot, parking_lot. Jacobs warned that highways, rail, parking lots and blank institutional edges act as "vacuums" that suppress foot traffic and isolate the park from its neighbourhood.
Source: Toronto Street Centreline (highways) + rail layer + OSM landuse + building footprints
Equity Context
Equity Context requires inputs not yet loaded for this park (Toronto Neighbourhood Profiles). Score is held at a neutral 50 with low confidence. Read with caution.
Source: Toronto Neighbourhood Profiles
Amenities (0)
No amenities recorded for this park.
Nearby active-edge features (41)
- parking lot0 m
- restaurant: The Rock Sports Bar6 m
- restaurant: Red Rock Restaurant13 m
- retail: Kiin Fashion19 m
- retail: MSD Motors37 m
- transit stop42 m
- restaurant: Salaama Hut44 m
- parking lot48 m
- transit stop: Kipling Avenue at Bethridge Road49 m
- restaurant: Lola's Kusina52 m
- retail: Gryf Delicatessen52 m
- retail: Do Home Healthcare57 m
- transit stop: Kipling Ave at Bethridge Rd69 m
- parking lot69 m
- parking lot72 m
- community: Toronto Public Library - Northern Elms90 m
- parking lot93 m
- retail: HearingLife100 m
- retail: Kal Tire110 m
- retail: Active Green + Ross111 m
- parking lot112 m
- restaurant: Wally's Grill117 m
- parking lot120 m
- parking lot126 m
- retail: easyfinancial127 m
- parking lot134 m
- parking lot134 m
- restaurant: Golden Asian135 m
- parking lot138 m
- parking lot140 m
- retail145 m
- rail148 m
- parking lot154 m
- parking lot156 m
- parking lot162 m
- parking lot165 m
- parking lot171 m
- restaurant: Solarium171 m
- parking lot181 m
- parking lot184 m
- transit stop: Kipling Avenue at Rexdale Boulevard190 m
Park profile
Five-axis radar across the structural dimensions.
Citywide percentile ranks
Across all Toronto parks in the dataset.
- Overall vitality29th
- Edge activation86th
- Connectivity24th
- Amenity diversity64th
- Natural comfort16th
- Enclosure6th
Most similar parks
Closest in metric space across the five structural dimensions.
- City Wide Open SpaceRavine / Naturalized Park32
- Etobicoke Hydro Green SpaceOther30
- City Wide Open SpaceRavine / Naturalized Park32
- City Wide Open SpaceWaterfront Park34
- G. Ross Lord ParkRavine / Naturalized Park33
Most opposite parks
Furthest in metric space. Useful for recognising what kind of park this isn’t.
- High ParkRavine / Naturalized Park47
- Kew GardensNeighbourhood Park71
- Ramsden ParkRavine / Naturalized Park43
- Leslie Grove ParkParkette68
- Trinity Bellwoods ParkNeighbourhood Park63
Human activity signals: not available
No activity signals have landed for this park yet. The model has scored its physical form but it can’t yet say how often it’s programmed, photographed, or walked through. See /data-ethics for what we will and will not collect.
Does this score feel accurate?
Your read of Etobicoke Hydro Green Spacematters. We’re testing whether the model lines up with how people actually use the park. Submissions are stored locally; no account needed.
Tell us how this park feels
We measure structure (canopy, edges, connectivity). You measure feeling. Both matter, and disagreement is itself useful civic data.
What would improve this park?
Generated from the weakest measured dimensions: a starting point, not a prescription.
- Activate the edges: encourage cafés, retail or community uses on the streets that face the park; replace blank or parking-lot edges where possible.
- Add or open more entrances and improve sidewalk continuity around the park. More permeability means more spontaneous use.
- Diversify what people can do in the park (playground, washroom, water, shade, performance, sport, garden): even small additions raise this score.
- Increase canopy and reduce paved area. Shade and water features extend usable hours and seasons.
- Encourage mid-rise, windowed frontages around the park so residents have direct sightlines onto it.
Data sources
- City of Toronto Open Data: Parks (Green Space)Polygon boundaries, official names, types.
- Parks & Recreation FacilitiesInventory of in-park amenities (washrooms, fields, rinks…).
- Toronto Pedestrian NetworkSidewalk segments around and through parks; estimated park entrances.
- Toronto Centreline V2Street segments + intersection nodes near park edges; trails and walkways.
- Toronto 3D MassingBuilding footprints + heights for edge-building counts, frontage density, and tower-in-the-park risk.
- Toronto Treed AreaTree canopy share inside park polygons via stratified-grid sampling.
- Toronto Waterbodies & RiversWater surface inside parks + nearest-water distance for cooling.
- Ravine & Natural Feature ProtectionRavine overlap as a cooling / natural-comfort signal.
- Toronto Street Tree InventoryTree count + density inside park polygons.
- Neighbourhood Profiles(Pending) Equity context proxy.
- OpenStreetMap (Overpass API)Cafés, restaurants, retail, transit stops, parking, highways, rail.