North York Hydro Green Space
Ravine / Naturalized Park, near the bottom of the city overall (score 25, rank ~11th percentile). Strongest: connectivity; weakest: edge activation.
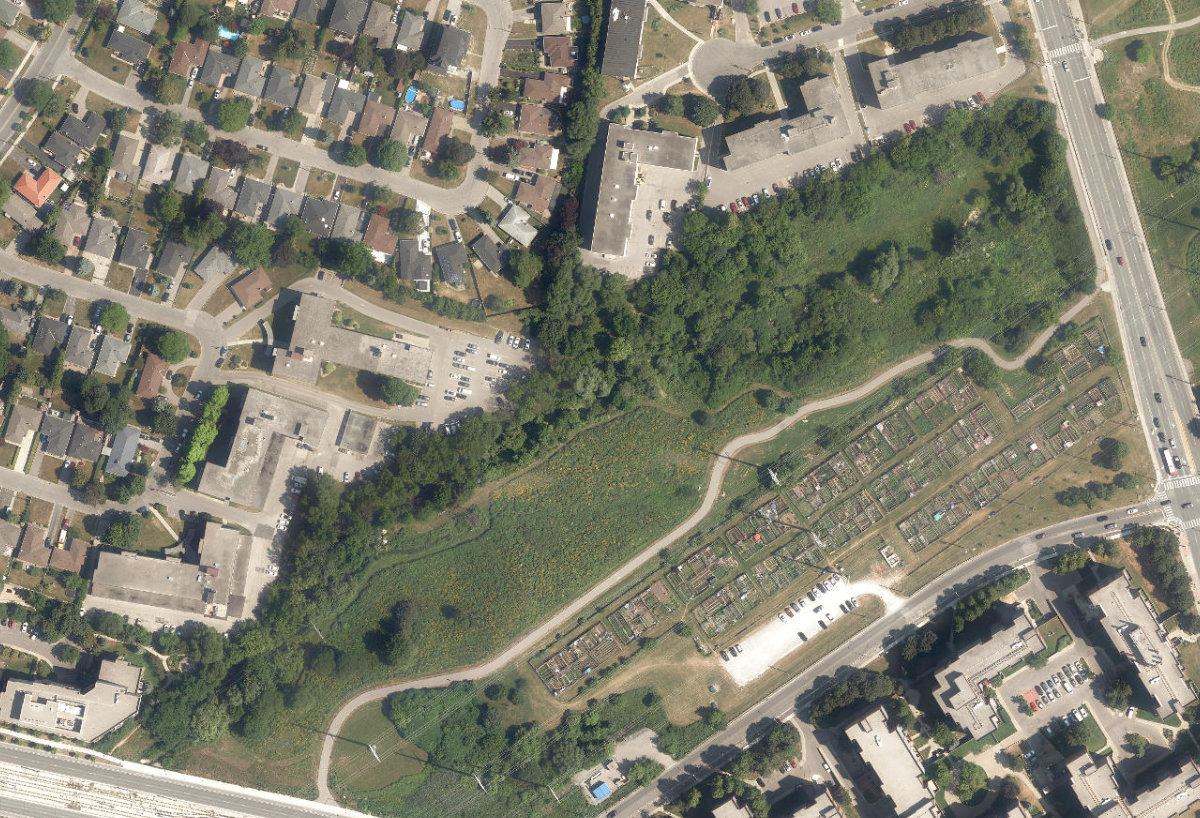
Aerial, City of Toronto orthophoto, ~8 cm/px source · cached 5/9/2026
North York Hydro Green Space scores 24.7 / 100. Strongest dimensions: enclosure / eyes on park and connectivity. Weakest: amenity diversity (0). Border-vacuum risk is elevated (100). This score is a transparent reading of Jane Jacobs-style vitality factors, not a definitive judgment.
Area · 3.52 ha
Weighted across six dimensions · confidence 63%
Scores are not bell-curved. Percentiles and expected scores provide context without changing the underlying model.
Loading map…
The parks map is loading.Explain this score
Where did the 25 come from? Each weighted contribution against a neutral 50 baseline. Green = pushed up; red = pulled down.
Sum of contributions = the headline score. A negative bar means that dimension dragged the park below the city-wide neutral baseline.
Why this park works
North York Hydro Green Space works because its connectivity score (61) is above average (25 transit stops sit within a 400 m walk; 11 intersections fall within 100 m of the edge).
What limits this park
North York Hydro Green Space is held back by edge activation (0, bottom quartile): the surrounding streets carry too few active uses to spill into the park; border-vacuum risk is also elevated (100).
Most distinctive characteristic
Most distinctive feature: exceptionally low edge activation (0, bottom quartile).
Jacobs reading
North York Hydro Green Space sits between an urban social park and an ecological retreat: moderately useful for both, exceptionally suited to neither.
Tradeoffs
- The park is enclosed by buildings (63) but the surrounding streets are quiet (edge activation 0): frame without animation.
- High connectivity coexists with high border-vacuum risk (100): much of that connectivity is to highways, rail, or parking lots, not to neighbourhoods.
Performance in context
- Reads as a modest underperformer relative to comparable parks (gap -11; cohort: medium Ravine / Naturalized Park ravine).
Typology classification
Classified as Ravine / Naturalized Park: 100% ravine overlap, 1% canopy. Secondary read: Neighbourhood Park (3.5 ha, framed by 15 mid-rise vs 0 towers).
Edge Activation
Within 100 m of the park edge: 1 active uses (retail) and 11 dead/hostile uses (parking_lot, rail, highway). Active edges keep "eyes on the park" through the day; parking lots, blank institutional walls, rail and highway frontages drain street life.
Source: OSM POIs (amenity/shop) + Toronto Building Footprints + land use
Connectivity
Connectivity blends paths, intersections, transit, entrances, and edge density. This park has 10 mapped paths/walkways and 10 sidewalk segments within 50 m; 11 street intersections within 100 m; 25 transit stops within a 400 m walk; 2 estimated access points across ~1,201 m of perimeter. moderate edge density, small superblock penalty applied. Source coverage: centreline, pedestrian_network, transit_osm.
Source: Toronto Centreline V2 + Pedestrian Network + OSM transit stops
Amenity Diversity
No amenities recorded. Score is 0 until inventory is loaded.
Source: Toronto Parks & Recreation Facilities + OSM amenity tags
Natural Comfort
Natural-comfort components for this park: 1.0% estimated tree canopy; 100.0% inside the ravine system; 1.0% water surface. Reading: ravine-cooled. Source coverage: treed_area, ravine, waterbodies. Impervious surface is approximated (Toronto's authoritative layer ships only as a raster GeoTIFF).
Source: Toronto Treed Area + Ravine + Waterbodies + Street Tree Inventory
Enclosure / Eyes on Park
27 buildings within 25 m of the park edge (15 mid-rise, 12 low-rise, 0 tower); avg edge height 8.4 m (~3 floors); 2.2 buildings per 100 m of 1,201 m perimeter (moderate frontage density); edges are low-rise (mostly 2 to 3 floors); no towers immediately adjacent. "Eyes on the park" come strongest from the 15 mid-rise edge buildings.
Source: Toronto 3D Massing (building footprints + heights)
Border Vacuum Risk
Border-vacuum factors within 50 m of the park: Line 5 Eglinton, Eglinton Avenue East, parking_lot, parking_lot, parking_lot, Eglinton Avenue East, Line 5 Eglinton. Jacobs warned that highways, rail, parking lots and blank institutional edges act as "vacuums" that suppress foot traffic and isolate the park from its neighbourhood.
Source: Toronto Street Centreline (highways) + rail layer + OSM landuse + building footprints
Equity Context
Equity Context requires inputs not yet loaded for this park (Toronto Neighbourhood Profiles). Score is held at a neutral 50 with low confidence. Read with caution.
Source: Toronto Neighbourhood Profiles
Amenities (0)
No amenities recorded for this park.
Nearby active-edge features (42)
- parking lot11 m
- highway: Eglinton Avenue East26 m
- parking lot27 m
- highway: Eglinton Avenue East42 m
- rail: Line 5 Eglinton42 m
- parking lot47 m
- rail: Line 5 Eglinton49 m
- parking lot: Jonesville Allotment Parking56 m
- parking lot68 m
- retail: Bargain Shark83 m
- parking lot87 m
- parking lot94 m
- parking lot108 m
- parking lot108 m
- transit stop111 m
- rail: Line 5 Eglinton115 m
- parking lot115 m
- transit stop: Jonesville Crescent125 m
- transit stop126 m
- transit stop129 m
- parking lot131 m
- parking lot141 m
- highway: Eglinton Avenue East141 m
- transit stop: Craigton Dr at Victoria Park Ave143 m
- parking lot147 m
- parking lot148 m
- community: The Hub157 m
- parking lot158 m
- retail: Cash Max160 m
- parking lot160 m
- parking lot162 m
- parking lot165 m
- parking lot167 m
- parking lot169 m
- retail: Especially for You Hair Design170 m
- transit stop: Jonesville Crescent East Side170 m
- retail: Pet Valu178 m
- parking lot180 m
- transit stop: Sloane181 m
- parking lot186 m
- parking lot192 m
- retail: Plush by Marina197 m
Park profile
Five-axis radar across the structural dimensions.
Citywide percentile ranks
Across all Toronto parks in the dataset.
- Overall vitality11th
- Edge activation9th
- Connectivity75th
- Amenity diversity13th
- Natural comfort41th
- Enclosure50th
Most similar parks
Closest in metric space across the five structural dimensions.
- CRESTWOOD COLLEGE - Building GroundsNeighbourhood Park32
- Scotia ParketteParkette25
- Seeley GreenbeltRavine / Naturalized Park33
- Newgate ParketteCorridor / Linear Park35
- East Highland Creek WatercourseWaterfront Park34
Most opposite parks
Furthest in metric space. Useful for recognising what kind of park this isn’t.
- Kew GardensNeighbourhood Park71
- Leslie Grove ParkParkette68
- Market Lane ParkUrban Plaza63
- Bellevue Square ParkCivic Square66
- Ryerson Community ParkUrban Plaza60
Human activity signals: not available
No activity signals have landed for this park yet. The model has scored its physical form but it can’t yet say how often it’s programmed, photographed, or walked through. See /data-ethics for what we will and will not collect.
Does this score feel accurate?
Your read of North York Hydro Green Spacematters. We’re testing whether the model lines up with how people actually use the park. Submissions are stored locally; no account needed.
Tell us how this park feels
We measure structure (canopy, edges, connectivity). You measure feeling. Both matter, and disagreement is itself useful civic data.
What would improve this park?
Generated from the weakest measured dimensions: a starting point, not a prescription.
- Activate the edges: encourage cafés, retail or community uses on the streets that face the park; replace blank or parking-lot edges where possible.
- Diversify what people can do in the park (playground, washroom, water, shade, performance, sport, garden): even small additions raise this score.
- Increase canopy and reduce paved area. Shade and water features extend usable hours and seasons.
- Mitigate border vacuums (highways, rail, parking) with active programming on the still-permeable edges and treat the hostile edge as a design challenge.
Data sources
- City of Toronto Open Data: Parks (Green Space)Polygon boundaries, official names, types.
- Parks & Recreation FacilitiesInventory of in-park amenities (washrooms, fields, rinks…).
- Toronto Pedestrian NetworkSidewalk segments around and through parks; estimated park entrances.
- Toronto Centreline V2Street segments + intersection nodes near park edges; trails and walkways.
- Toronto 3D MassingBuilding footprints + heights for edge-building counts, frontage density, and tower-in-the-park risk.
- Toronto Treed AreaTree canopy share inside park polygons via stratified-grid sampling.
- Toronto Waterbodies & RiversWater surface inside parks + nearest-water distance for cooling.
- Ravine & Natural Feature ProtectionRavine overlap as a cooling / natural-comfort signal.
- Toronto Street Tree InventoryTree count + density inside park polygons.
- Neighbourhood Profiles(Pending) Equity context proxy.
- OpenStreetMap (Overpass API)Cafés, restaurants, retail, transit stops, parking, highways, rail.