North York Hydro Green Space
Tower-Community Green Space, middle of the pack overall (score 33, rank ~45th percentile). Strongest: edge activation; weakest: enclosure.
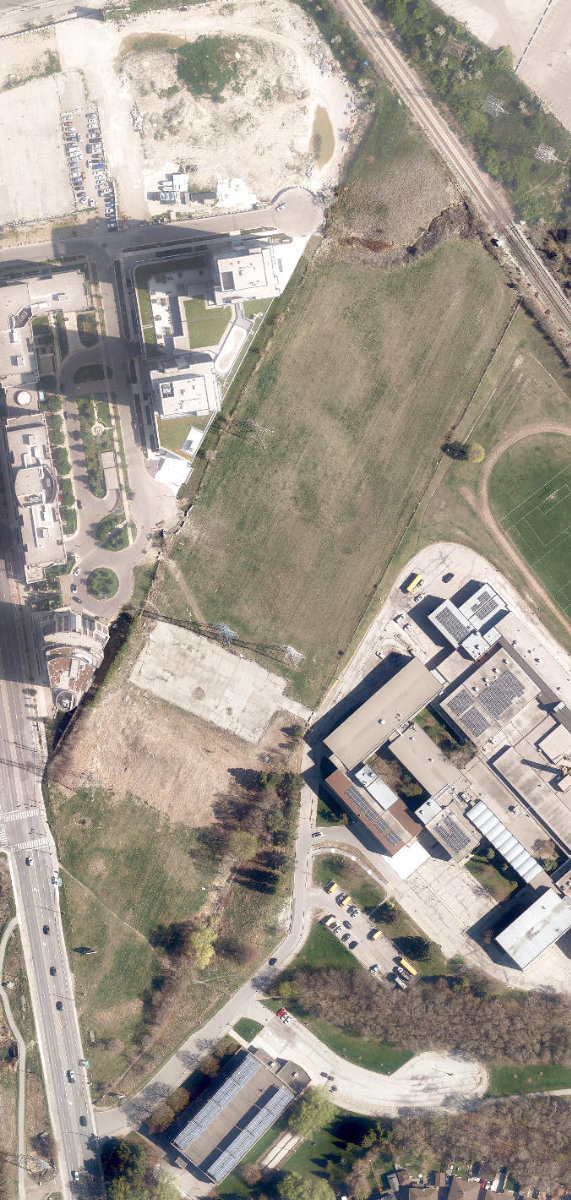
Aerial, City of Toronto orthophoto, ~8 cm/px source · cached 5/9/2026
North York Hydro Green Space scores 33.1 / 100. Strongest dimensions: connectivity and enclosure / eyes on park. Weakest: amenity diversity (0). Border-vacuum risk is low. This score is a transparent reading of Jane Jacobs-style vitality factors, not a definitive judgment.
Area · 4.59 ha
Weighted across six dimensions · confidence 63%
Scores are not bell-curved. Percentiles and expected scores provide context without changing the underlying model.
Loading map…
The parks map is loading.Explain this score
Where did the 33 come from? Each weighted contribution against a neutral 50 baseline. Green = pushed up; red = pulled down.
Sum of contributions = the headline score. A negative bar means that dimension dragged the park below the city-wide neutral baseline.
Why this park works
North York Hydro Green Space works because its edge activation score (9) is middle of the pack and its natural comfort (50) is also above-average.
What limits this park
North York Hydro Green Space is held back by enclosure (51, bottom quartile).
Most distinctive characteristic
Most distinctive feature: exceptionally low enclosure (51, bottom quartile).
Jacobs reading
North York Hydro Green Space sits between an urban social park and an ecological retreat: moderately useful for both, exceptionally suited to neither.
Typology classification
Classified as Tower-Community Green Space: 33 towers vs 14 mid-rise within 25 m on a 4.6 ha park
Edge Activation
Within 100 m of the park edge: 3 active uses (transit_stop) and 3 dead/hostile uses (parking_lot). Active edges keep "eyes on the park" through the day; parking lots, blank institutional walls, rail and highway frontages drain street life.
Source: OSM POIs (amenity/shop) + Toronto Building Footprints + land use
Connectivity
Connectivity blends paths, intersections, transit, entrances, and edge density. This park has 3 mapped paths/walkways and 16 sidewalk segments within 50 m; 5 street intersections within 100 m; 21 transit stops within a 400 m walk; 0 estimated access points across ~1,140 m of perimeter. low edge density, significant superblock penalty applied. Source coverage: centreline, pedestrian_network, transit_osm.
Source: Toronto Centreline V2 + Pedestrian Network + OSM transit stops
Amenity Diversity
No amenities recorded. Score is 0 until inventory is loaded.
Source: Toronto Parks & Recreation Facilities + OSM amenity tags
Natural Comfort
Natural-comfort components for this park: 2.8% estimated tree canopy; 30.6% inside the ravine system; nearest waterbody ~228 m. Reading: ravine-cooled. Source coverage: treed_area, ravine, waterbodies. Impervious surface is approximated (Toronto's authoritative layer ships only as a raster GeoTIFF).
Source: Toronto Treed Area + Ravine + Waterbodies + Street Tree Inventory
Enclosure / Eyes on Park
57 buildings within 25 m of the park edge (14 mid-rise, 10 low-rise, 33 tower); avg edge height 52.0 m (~17 floors); 5.0 buildings per 100 m of 1,140 m perimeter (strong frontage density); edges dominated by towers; 33 towers ≥ 40 m within 25 m of the edge. "Eyes on the park" come strongest from the 14 mid-rise edge buildings.
Source: Toronto 3D Massing (building footprints + heights)
Border Vacuum Risk
Border-vacuum factors within 50 m of the park: parking_lot, parking_lot. Jacobs warned that highways, rail, parking lots and blank institutional edges act as "vacuums" that suppress foot traffic and isolate the park from its neighbourhood.
Source: Toronto Street Centreline (highways) + rail layer + OSM landuse + building footprints
Equity Context
Equity Context requires inputs not yet loaded for this park (Toronto Neighbourhood Profiles). Score is held at a neutral 50 with low confidence. Read with caution.
Source: Toronto Neighbourhood Profiles
Amenities (0)
No amenities recorded for this park.
Nearby active-edge features (36)
- parking lot0 m
- transit stop: Lanyard Road4 m
- transit stop: 3395 Weston Road5 m
- transit stop: Lanyard Road29 m
- parking lot34 m
- parking lot72 m
- parking lot101 m
- parking lot105 m
- transit stop: Habitant Drive109 m
- rail: MacTier Subdivision110 m
- rail: MacTier Subdivision111 m
- transit stop: Habitant Drive130 m
- parking lot132 m
- parking lot139 m
- parking lot150 m
- restaurant: Caribbean Queen151 m
- retail: Johnny's Barber Shop & Accessories159 m
- parking lot167 m
- restaurant: Caribu West Indian Cuisine168 m
- parking lot173 m
- transit stop: Emery174 m
- parking lot174 m
- parking lot175 m
- restaurant: Leila's Curry Pot & Roti Hut177 m
- parking lot180 m
- parking lot181 m
- retail: Designs by Sartori183 m
- retail: Money Mart186 m
- restaurant: Thanh Maj188 m
- rail: MacTier Subdivision189 m
- restaurant: Regina Noodle Products191 m
- restaurant: Pizza Pros192 m
- retail: Freedom Mobile195 m
- retail: Caribbean Island Food Mart196 m
- transit stop: Weston Rd198 m
- restaurant: Golden Star Restaurant200 m
Park profile
Five-axis radar across the structural dimensions.
Citywide percentile ranks
Across all Toronto parks in the dataset.
- Overall vitality45th
- Edge activation70th
- Connectivity60th
- Amenity diversity23th
- Natural comfort60th
- Enclosure16th
Most similar parks
Closest in metric space across the five structural dimensions.
- North Agincourt ParkNeighbourhood Park35
- City Wide Open SpaceRavine / Naturalized Park37
- Etobicoke Hydro Green SpaceCorridor / Linear Park36
- Jolly Miller ParkRavine / Naturalized Park29
- Humber River WatercourseWaterfront Park33
Most opposite parks
Furthest in metric space. Useful for recognising what kind of park this isn’t.
- Leslie Grove ParkParkette68
- Kew GardensNeighbourhood Park71
- ALEX WILSON COMMUNITY GARDEN - Open Green SpaceUrban Plaza59
- Market Lane ParkUrban Plaza63
- Bellevue Square ParkCivic Square66
Human activity signals: not available
No activity signals have landed for this park yet. The model has scored its physical form but it can’t yet say how often it’s programmed, photographed, or walked through. See /data-ethics for what we will and will not collect.
Does this score feel accurate?
Your read of North York Hydro Green Spacematters. We’re testing whether the model lines up with how people actually use the park. Submissions are stored locally; no account needed.
Tell us how this park feels
We measure structure (canopy, edges, connectivity). You measure feeling. Both matter, and disagreement is itself useful civic data.
What would improve this park?
Generated from the weakest measured dimensions: a starting point, not a prescription.
- Activate the edges: encourage cafés, retail or community uses on the streets that face the park; replace blank or parking-lot edges where possible.
- Diversify what people can do in the park (playground, washroom, water, shade, performance, sport, garden): even small additions raise this score.
Data sources
- City of Toronto Open Data: Parks (Green Space)Polygon boundaries, official names, types.
- Parks & Recreation FacilitiesInventory of in-park amenities (washrooms, fields, rinks…).
- Toronto Pedestrian NetworkSidewalk segments around and through parks; estimated park entrances.
- Toronto Centreline V2Street segments + intersection nodes near park edges; trails and walkways.
- Toronto 3D MassingBuilding footprints + heights for edge-building counts, frontage density, and tower-in-the-park risk.
- Toronto Treed AreaTree canopy share inside park polygons via stratified-grid sampling.
- Toronto Waterbodies & RiversWater surface inside parks + nearest-water distance for cooling.
- Ravine & Natural Feature ProtectionRavine overlap as a cooling / natural-comfort signal.
- Toronto Street Tree InventoryTree count + density inside park polygons.
- Neighbourhood Profiles(Pending) Equity context proxy.
- OpenStreetMap (Overpass API)Cafés, restaurants, retail, transit stops, parking, highways, rail.