Don River Watercourse
Waterfront Park, middle of the pack overall (score 31, rank ~37th percentile). Strongest: connectivity; weakest: edge activation.
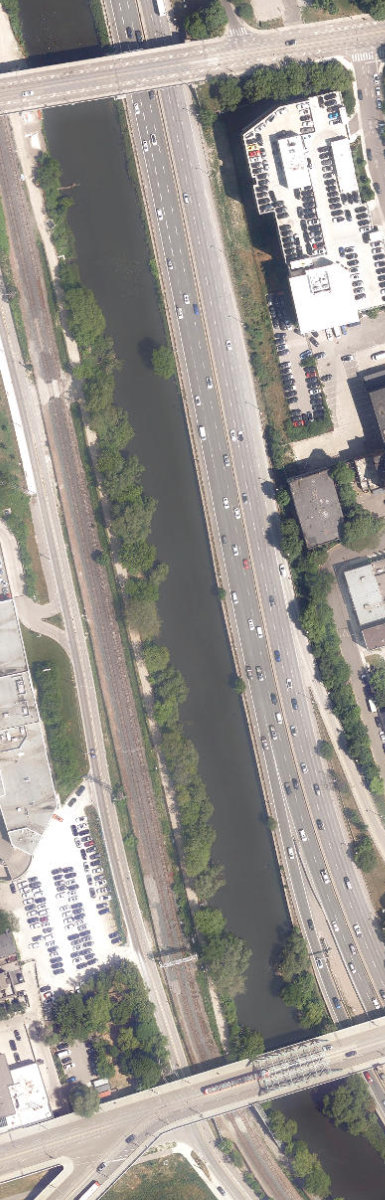
Aerial, City of Toronto orthophoto, ~8 cm/px source · cached 5/9/2026
Don River Watercourse scores 31.4 / 100. Strongest dimensions: connectivity and enclosure / eyes on park. Weakest: amenity diversity (0). Border-vacuum risk is elevated (78). This score is a transparent reading of Jane Jacobs-style vitality factors, not a definitive judgment.
Area · 1.62 ha
Weighted across six dimensions · confidence 63%
Scores are not bell-curved. Percentiles and expected scores provide context without changing the underlying model.
Loading map…
The parks map is loading.Explain this score
Where did the 31 come from? Each weighted contribution against a neutral 50 baseline. Green = pushed up; red = pulled down.
Sum of contributions = the headline score. A negative bar means that dimension dragged the park below the city-wide neutral baseline.
Why this park works
Don River Watercourse works because its connectivity score (72) is in the top tier and its natural comfort (55) is also above-average (34 transit stops sit within a 400 m walk; 36 intersections fall within 100 m of the edge).
What limits this park
Don River Watercourse's edges are fronted by border-vacuum land uses (highways, rail, parking, blank institutional), risk score 78.
Most distinctive characteristic
Most distinctive feature: exceptionally high connectivity (72, top decile).
Jacobs reading
Don River Watercourse sits between an urban social park and an ecological retreat: moderately useful for both, exceptionally suited to neither.
Tradeoffs
- The park is enclosed by buildings (67) but the surrounding streets are quiet (edge activation 0): frame without animation.
- High connectivity coexists with high border-vacuum risk (78): much of that connectivity is to highways, rail, or parking lots, not to neighbourhoods.
Typology classification
Classified as Waterfront Park: 84% water surface inside park. Secondary read: Ravine / Naturalized Park (100% ravine overlap, 8% canopy).
Edge Activation
Within 100 m of the park edge: 7 active uses (retail, restaurant) and 14 dead/hostile uses (highway, parking_lot, rail). Active edges keep "eyes on the park" through the day; parking lots, blank institutional walls, rail and highway frontages drain street life.
Source: OSM POIs (amenity/shop) + Toronto Building Footprints + land use
Connectivity
Connectivity blends paths, intersections, transit, entrances, and edge density. This park has 5 mapped paths/walkways and 27 sidewalk segments within 50 m; 36 street intersections within 100 m; 34 transit stops within a 400 m walk; 1 estimated access points across ~951 m of perimeter. edge density is healthy, no superblock penalty. Source coverage: centreline, pedestrian_network, transit_osm.
Source: Toronto Centreline V2 + Pedestrian Network + OSM transit stops
Amenity Diversity
No amenities recorded. Score is 0 until inventory is loaded.
Source: Toronto Parks & Recreation Facilities + OSM amenity tags
Natural Comfort
Natural-comfort components for this park: 8.4% estimated tree canopy; 100.0% inside the ravine system; 84.1% water surface. Reading: ravine-cooled. Source coverage: treed_area, ravine, waterbodies. Impervious surface is approximated (Toronto's authoritative layer ships only as a raster GeoTIFF).
Source: Toronto Treed Area + Ravine + Waterbodies + Street Tree Inventory
Enclosure / Eyes on Park
32 buildings within 25 m of the park edge (20 mid-rise, 7 low-rise, 5 tower); avg edge height 28.7 m (~10 floors); 3.4 buildings per 100 m of 951 m perimeter (strong frontage density); edges lean tall but still framed; 5 towers ≥ 40 m within 25 m of the edge. "Eyes on the park" come strongest from the 20 mid-rise edge buildings.
Source: Toronto 3D Massing (building footprints + heights)
Border Vacuum Risk
Border-vacuum factors within 50 m of the park: Don Valley Parkway, GO Transit - Bala Subdivision, Don Valley Parkway. Jacobs warned that highways, rail, parking lots and blank institutional edges act as "vacuums" that suppress foot traffic and isolate the park from its neighbourhood.
Source: Toronto Street Centreline (highways) + rail layer + OSM landuse + building footprints
Equity Context
Equity Context requires inputs not yet loaded for this park (Toronto Neighbourhood Profiles). Score is held at a neutral 50 with low confidence. Read with caution.
Source: Toronto Neighbourhood Profiles
Amenities (0)
No amenities recorded for this park.
Nearby active-edge features (68)
- highway: Don Valley Parkway11 m
- highway: Don Valley Parkway24 m
- rail: GO Transit - Bala Subdivision31 m
- retail47 m
- parking lot53 m
- retail: Audi Downtown Toronto65 m
- rail: GO Transit - Bala Subdivision66 m
- parking lot67 m
- parking lot69 m
- retail: Guff73 m
- restaurant: il ponte73 m
- highway: Don Valley Parkway74 m
- parking lot76 m
- parking lot77 m
- parking lot77 m
- highway: Don Valley Parkway78 m
- parking lot87 m
- parking lot91 m
- retail: Motorcade Industries Inc93 m
- retail: Isle Tattoo97 m
- retail: Toyota Downtown99 m
- retail: Broadview Hot Yoga108 m
- retail: Blackbird Bakery118 m
- parking lot120 m
- transit stop: Carroll Street124 m
- parking lot126 m
- parking lot126 m
- retail: Album Hair126 m
- retail: Amavi Atelier128 m
- retail: Downtown Lincoln/Downtown Ford131 m
- cafe: Bevy131 m
- retail: The Cannonball132 m
- retail: Genesis Downtown134 m
- cafe: Dark Horse Espresso Bar135 m
- parking lot137 m
- retail: East Toronto Foot Care138 m
- parking lot148 m
- parking lot149 m
- retail: Downtown Toyota Pre-owned151 m
- transit stop: River Street152 m
- parking lot152 m
- retail: Gears153 m
- highway: Don Valley Parkway155 m
- retail157 m
- retail: Ride Away Bikes158 m
- transit stop: River Street161 m
- parking lot164 m
- retail: Kalamkaar164 m
- retail: Pharmasave River St. Pharmacy167 m
- retail: Bright River General Store168 m
- retail: Jiugi Flowers168 m
- transit stop: Munro Street168 m
- transit stop: Queen Street East169 m
- parking lot174 m
- parking lot176 m
- parking lot178 m
- transit stop: Carroll Street182 m
- transit stop: King Street East186 m
- transit stop: River Street187 m
- retail: Ede's African Grocery & Spiritual Store188 m
- transit stop: River Street191 m
- restaurant: Wendy's191 m
- transit stop: Munro Street192 m
- parking lot193 m
- cafe: Tim Hortons193 m
- retail: INS Market195 m
- transit stop: Dundas Street East196 m
- transit stop: River Street198 m
Park profile
Five-axis radar across the structural dimensions.
Citywide percentile ranks
Across all Toronto parks in the dataset.
- Overall vitality37th
- Edge activation53th
- Connectivity92th
- Amenity diversity60th
- Natural comfort68th
- Enclosure62th
Most similar parks
Closest in metric space across the five structural dimensions.
- Collingsbrook ParketteWaterfront Park38
- Pine Hills CemeteryWaterfront Park29
- Black Creek Site EastRavine / Naturalized Park34
- Browns Line-Lakeshore ParketteCorridor / Linear Park29
- Newtonbrook ParkRavine / Naturalized Park34
Most opposite parks
Furthest in metric space. Useful for recognising what kind of park this isn’t.
- Joseph Burr Tyrrell ParkUrban Plaza50
- Leslie Grove ParkParkette68
- Kew GardensNeighbourhood Park71
- Simcoe ParkTower-Community Green Space51
- Queen'S Quay Traffic IslandWaterfront Park49
Human activity signals: not available
No activity signals have landed for this park yet. The model has scored its physical form but it can’t yet say how often it’s programmed, photographed, or walked through. See /data-ethics for what we will and will not collect.
Does this score feel accurate?
Your read of Don River Watercoursematters. We’re testing whether the model lines up with how people actually use the park. Submissions are stored locally; no account needed.
Tell us how this park feels
We measure structure (canopy, edges, connectivity). You measure feeling. Both matter, and disagreement is itself useful civic data.
What would improve this park?
Generated from the weakest measured dimensions: a starting point, not a prescription.
- Activate the edges: encourage cafés, retail or community uses on the streets that face the park; replace blank or parking-lot edges where possible.
- Diversify what people can do in the park (playground, washroom, water, shade, performance, sport, garden): even small additions raise this score.
- Mitigate border vacuums (highways, rail, parking) with active programming on the still-permeable edges and treat the hostile edge as a design challenge.
Data sources
- City of Toronto Open Data: Parks (Green Space)Polygon boundaries, official names, types.
- Parks & Recreation FacilitiesInventory of in-park amenities (washrooms, fields, rinks…).
- Toronto Pedestrian NetworkSidewalk segments around and through parks; estimated park entrances.
- Toronto Centreline V2Street segments + intersection nodes near park edges; trails and walkways.
- Toronto 3D MassingBuilding footprints + heights for edge-building counts, frontage density, and tower-in-the-park risk.
- Toronto Treed AreaTree canopy share inside park polygons via stratified-grid sampling.
- Toronto Waterbodies & RiversWater surface inside parks + nearest-water distance for cooling.
- Ravine & Natural Feature ProtectionRavine overlap as a cooling / natural-comfort signal.
- Toronto Street Tree InventoryTree count + density inside park polygons.
- Neighbourhood Profiles(Pending) Equity context proxy.
- OpenStreetMap (Overpass API)Cafés, restaurants, retail, transit stops, parking, highways, rail.