Matt Cohen Park
Urban Plaza, below average overall (score 27, rank ~20th percentile). Strongest: enclosure; weakest: natural comfort.
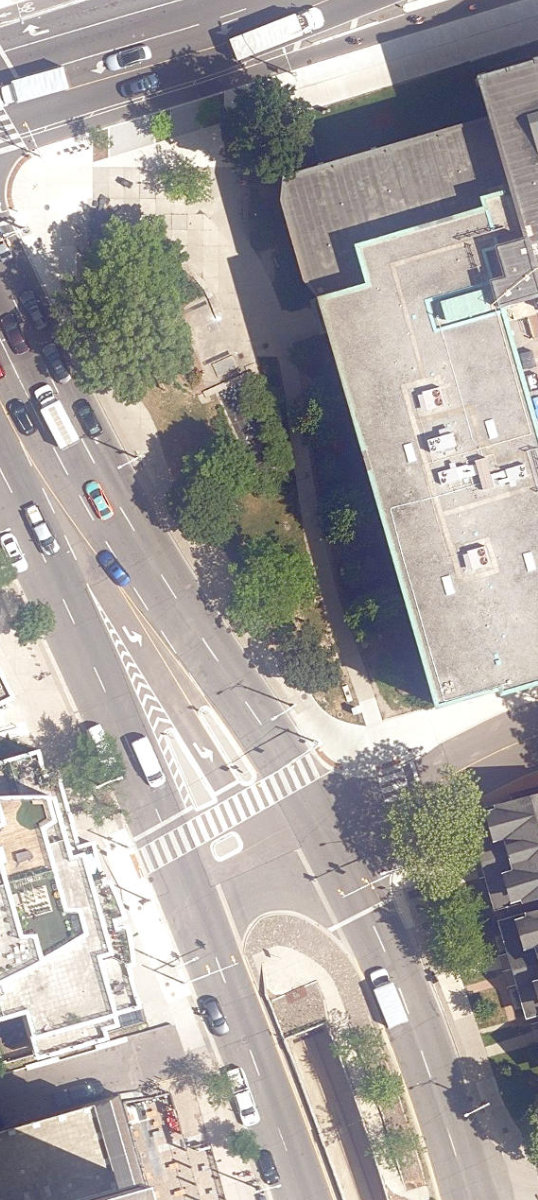
Aerial, City of Toronto orthophoto, ~8 cm/px source · cached 5/9/2026
Matt Cohen Park scores 27.4 / 100. Strongest dimensions: enclosure / eyes on park and connectivity. Weakest: amenity diversity (0). Border-vacuum risk is elevated (100). This score is a transparent reading of Jane Jacobs-style vitality factors, not a definitive judgment.
Area · 0.14 ha
Weighted across six dimensions · confidence 56%
Scores are not bell-curved. Percentiles and expected scores provide context without changing the underlying model.
Loading map…
The parks map is loading.Explain this score
Where did the 27 come from? Each weighted contribution against a neutral 50 baseline. Green = pushed up; red = pulled down.
Sum of contributions = the headline score. A negative bar means that dimension dragged the park below the city-wide neutral baseline.
Why this park works
Matt Cohen Park works because its enclosure score (89) is one of the city's strongest and its connectivity (62) is also top quartile (35 mid-rise buildings frame the edge with passive surveillance).
What limits this park
Matt Cohen Park's edges are fronted by border-vacuum land uses (highways, rail, parking, blank institutional), risk score 100.
Most distinctive characteristic
Most distinctive feature: exceptionally high enclosure (89, top decile).
Jacobs reading
Matt Cohen Park sits between an urban social park and an ecological retreat: moderately useful for both, exceptionally suited to neither.
Tradeoffs
- The park is enclosed by buildings (89) but the surrounding streets are quiet (edge activation 0): frame without animation.
- 14 nearby towers cast wind and shadow without contributing canopy: passive surveillance is plentiful but human-scale comfort is not.
- High connectivity coexists with high border-vacuum risk (100): much of that connectivity is to highways, rail, or parking lots, not to neighbourhoods.
Performance in context
- Reads as a modest underperformer relative to comparable parks (gap -9; cohort: pocket Urban Plaza).
Typology classification
Classified as Urban Plaza: 1445 m², paved (0% canopy), 24.9 buildings/100 m
Edge Activation
Within 100 m of the park edge: 26 active uses (transit_stop, retail, cafe, restaurant) and 12 dead/hostile uses (parking_lot, highway). Active edges keep "eyes on the park" through the day; parking lots, blank institutional walls, rail and highway frontages drain street life.
Source: OSM POIs (amenity/shop) + Toronto Building Footprints + land use
Connectivity
Connectivity blends paths, intersections, transit, entrances, and edge density. This park has 0 mapped paths/walkways and 15 sidewalk segments within 50 m; 9 street intersections within 100 m; 24 transit stops within a 400 m walk; 1 estimated access points across ~257 m of perimeter. edge density is healthy, no superblock penalty. Source coverage: centreline, pedestrian_network, transit_osm.
Source: Toronto Centreline V2 + Pedestrian Network + OSM transit stops
Amenity Diversity
No amenities recorded. Score is 0 until inventory is loaded.
Source: Toronto Parks & Recreation Facilities + OSM amenity tags
Natural Comfort
Natural-comfort components for this park: ~8.4% effective canopy (0.0% from contiguous tree polygons + scattered tree density); 12 city-mapped trees inside the polygon (12.0/ha). Reading: exposed. Source coverage: street_trees. Impervious surface is approximated (Toronto's authoritative layer ships only as a raster GeoTIFF).
Source: Toronto Treed Area + Ravine + Waterbodies + Street Tree Inventory
Enclosure / Eyes on Park
64 buildings within 25 m of the park edge (35 mid-rise, 15 low-rise, 14 tower); avg edge height 20.9 m (~7 floors); 24.9 buildings per 100 m of 257 m perimeter (strong frontage density); edges are at a Jacobs-scale walkable mid-rise (3 to 7 floors); 14 towers ≥ 40 m within 25 m of the edge. "Eyes on the park" come strongest from the 35 mid-rise edge buildings.
Source: Toronto 3D Massing (building footprints + heights)
Border Vacuum Risk
Border-vacuum factors within 50 m of the park: Bloor Street West, Bloor Street West, Bloor Street West, parking_lot. Jacobs warned that highways, rail, parking lots and blank institutional edges act as "vacuums" that suppress foot traffic and isolate the park from its neighbourhood.
Source: Toronto Street Centreline (highways) + rail layer + OSM landuse + building footprints
Equity Context
Equity Context requires inputs not yet loaded for this park (Toronto Neighbourhood Profiles). Score is held at a neutral 50 with low confidence. Read with caution.
Source: Toronto Neighbourhood Profiles
Amenities (0)
No amenities recorded for this park.
Nearby active-edge features (67)
- highway: Bloor Street West13 m
- highway: Bloor Street West13 m
- transit stop: Spadina Avenue22 m
- retail: Republic of Hair25 m
- retail: Wine Rack30 m
- retail: Sutherland-Chan Clinic31 m
- retail: Three Cent Copy Centre31 m
- highway: Bloor Street West31 m
- retail: Enchanting beauty32 m
- transit stop: Spadina Avenue38 m
- parking lot43 m
- retail: Nice Cleaners46 m
- restaurant: Pita Land47 m
- retail: 7-Eleven48 m
- highway: Bloor Street West51 m
- cafe: Tim Hortons52 m
- retail52 m
- retail: Duke53 m
- restaurant: Majestic Shawarma59 m
- parking lot62 m
- restaurant: Daily Dumpling66 m
- transit stop: Spadina Station68 m
- retail: Freedom Mobile69 m
- highway: Bloor Street West69 m
- retail: Cuppa Tea73 m
- transit stop: Spadina Station74 m
- highway: Bloor Street West76 m
- retail: La La Bakeshop76 m
- parking lot77 m
- retail: glossix79 m
- restaurant: Zaad82 m
- transit stop: Spadina Road East Entrance84 m
- parking lot87 m
- parking lot88 m
- transit stop: Spadina Road West Entrance91 m
- restaurant: WooJoo Bunsik92 m
- highway: Bloor Street West99 m
- restaurant: Masters99 m
- parking lot107 m
- parking lot113 m
- transit stop: Spadina116 m
- transit stop: Spadina119 m
- restaurant: Bhoj Indian Cuisine125 m
- transit stop: Sussex Avenue129 m
- highway: Bloor Street West133 m
- parking lot141 m
- highway: Bloor Street West142 m
- parking lot144 m
- transit stop: Sussex Avenue156 m
- highway: Bloor Street West160 m
- retail: Chelsea Shop166 m
- restaurant: Wild Wing166 m
- parking lot171 m
- highway: Bloor Street West171 m
- restaurant: Ghazale174 m
- transit stop: Walmer Road174 m
- retail: Annex Photo176 m
- restaurant: Burrito Bandidos178 m
- parking lot178 m
- retail181 m
- restaurant: Sushi Maido183 m
- retail: Galleria The Kitchen Express184 m
- highway: Bloor Street West187 m
- restaurant: So Famous189 m
- parking lot190 m
- retail: COBS Bread194 m
- restaurant: Kenzo Ramen199 m
Park profile
Five-axis radar across the structural dimensions.
Citywide percentile ranks
Across all Toronto parks in the dataset.
- Overall vitality20th
- Edge activation39th
- Connectivity78th
- Amenity diversity45th
- Natural comfort38th
- Enclosure95th
Most similar parks
Closest in metric space across the five structural dimensions.
- Springhurst ParketteCorridor / Linear Park32
- Princess Street ParkUrban Plaza34
- MARJORY CARTON APARTMENTS - Building GroundsUrban Plaza33
- Broadview Subway Station ParketteUrban Plaza35
- Maughan Crescent ParketteUrban Plaza37
Most opposite parks
Furthest in metric space. Useful for recognising what kind of park this isn’t.
- Toronto Islands - Muggs Island ParkRavine / Naturalized Park25
- Trca Lands ( 26)Ravine / Naturalized Park27
- Rouge ParkWaterfront Park25
- Rouge ParkRavine / Naturalized Park28
- Toronto Islands - Island ParkWaterfront Park52
Human activity signals: not available
No activity signals have landed for this park yet. The model has scored its physical form but it can’t yet say how often it’s programmed, photographed, or walked through. See /data-ethics for what we will and will not collect.
Does this score feel accurate?
Your read of Matt Cohen Parkmatters. We’re testing whether the model lines up with how people actually use the park. Submissions are stored locally; no account needed.
Tell us how this park feels
We measure structure (canopy, edges, connectivity). You measure feeling. Both matter, and disagreement is itself useful civic data.
What would improve this park?
Generated from the weakest measured dimensions: a starting point, not a prescription.
- Activate the edges: encourage cafés, retail or community uses on the streets that face the park; replace blank or parking-lot edges where possible.
- Diversify what people can do in the park (playground, washroom, water, shade, performance, sport, garden): even small additions raise this score.
- Increase canopy and reduce paved area. Shade and water features extend usable hours and seasons.
- Mitigate border vacuums (highways, rail, parking) with active programming on the still-permeable edges and treat the hostile edge as a design challenge.
Data sources
- City of Toronto Open Data: Parks (Green Space)Polygon boundaries, official names, types.
- Parks & Recreation FacilitiesInventory of in-park amenities (washrooms, fields, rinks…).
- Toronto Pedestrian NetworkSidewalk segments around and through parks; estimated park entrances.
- Toronto Centreline V2Street segments + intersection nodes near park edges; trails and walkways.
- Toronto 3D MassingBuilding footprints + heights for edge-building counts, frontage density, and tower-in-the-park risk.
- Toronto Treed AreaTree canopy share inside park polygons via stratified-grid sampling.
- Toronto Waterbodies & RiversWater surface inside parks + nearest-water distance for cooling.
- Ravine & Natural Feature ProtectionRavine overlap as a cooling / natural-comfort signal.
- Toronto Street Tree InventoryTree count + density inside park polygons.
- Neighbourhood Profiles(Pending) Equity context proxy.
- OpenStreetMap (Overpass API)Cafés, restaurants, retail, transit stops, parking, highways, rail.