Don Mills Local Park
Urban Plaza, middle of the pack overall (score 37, rank ~61th percentile). Strongest: enclosure; weakest: edge activation.
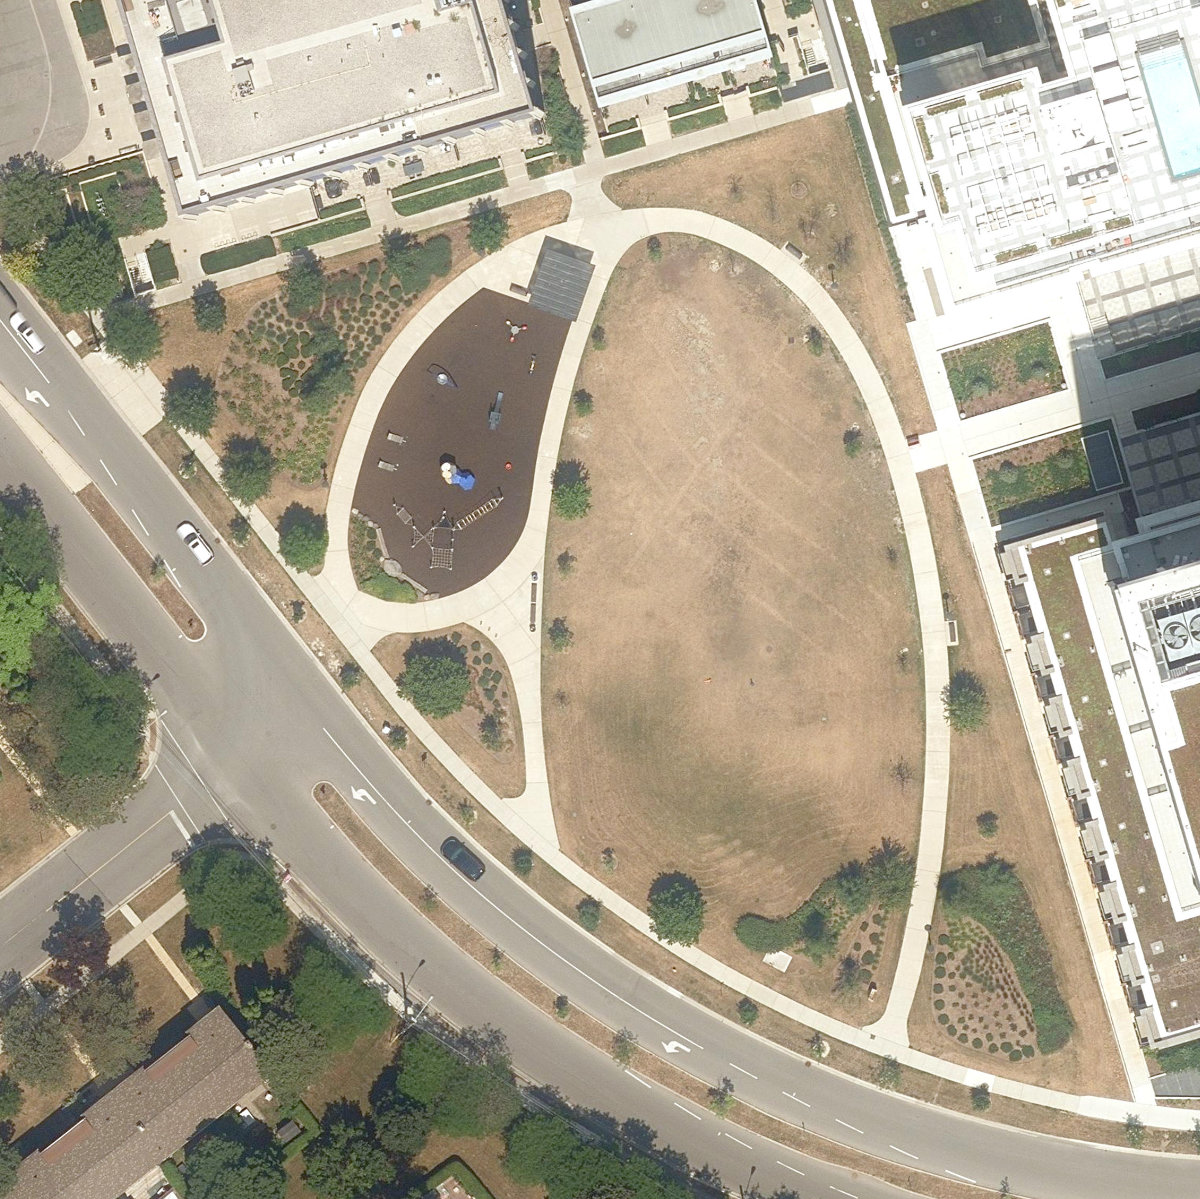
Aerial, City of Toronto orthophoto, ~8 cm/px source · cached 5/9/2026
Don Mills Local Park scores 36.6 / 100. Strongest dimensions: enclosure / eyes on park and connectivity. Weakest: edge activation (0). Border-vacuum risk is low. This score is a transparent reading of Jane Jacobs-style vitality factors, not a definitive judgment.
Area · 0.51 ha
Weighted across six dimensions · confidence 68%
Scores are not bell-curved. Percentiles and expected scores provide context without changing the underlying model.
Loading map…
The parks map is loading.Explain this score
Where did the 37 come from? Each weighted contribution against a neutral 50 baseline. Green = pushed up; red = pulled down.
Sum of contributions = the headline score. A negative bar means that dimension dragged the park below the city-wide neutral baseline.
Why this park works
Don Mills Local Park works because its enclosure score (80) is above average and its amenity diversity (12) is also above-average (17 mid-rise buildings frame the edge with passive surveillance).
What limits this park
Don Mills Local Park is held back by edge activation (0, below-average): the surrounding streets carry too few active uses to spill into the park.
Most distinctive characteristic
Most distinctive feature: exceptionally high enclosure (80, top quartile).
Jacobs reading
Don Mills Local Park sits between an urban social park and an ecological retreat: moderately useful for both, exceptionally suited to neither.
Tradeoffs
- The park is enclosed by buildings (80) but the surrounding streets are quiet (edge activation 0): frame without animation.
- 8 nearby towers cast wind and shadow without contributing canopy: passive surveillance is plentiful but human-scale comfort is not.
Typology classification
Classified as Urban Plaza: 5118 m², paved (0% canopy), 13.4 buildings/100 m
Edge Activation
Within 100 m of the park edge: 2 active uses (restaurant) and 6 dead/hostile uses (parking_lot). Active edges keep "eyes on the park" through the day; parking lots, blank institutional walls, rail and highway frontages drain street life.
Source: OSM POIs (amenity/shop) + Toronto Building Footprints + land use
Connectivity
Connectivity blends paths, intersections, transit, entrances, and edge density. This park has 0 mapped paths/walkways and 13 sidewalk segments within 50 m; 4 street intersections within 100 m; 18 transit stops within a 400 m walk; 0 estimated access points across ~314 m of perimeter. moderate edge density, small superblock penalty applied. Source coverage: centreline, pedestrian_network, transit_osm.
Source: Toronto Centreline V2 + Pedestrian Network + OSM transit stops
Amenity Diversity
1 distinct amenity types in the park (playground). Diversity, not raw count, drives the score so a park with many distinct activity types can outrank a larger park that repeats the same use.
Source: Toronto Parks & Recreation Facilities + OSM amenity tags
Natural Comfort
Natural-comfort components for this park: ~4.9% effective canopy (0.0% from contiguous tree polygons + scattered tree density); nearest waterbody ~675 m; 7 city-mapped trees inside the polygon (7.0/ha). Reading: exposed. Source coverage: waterbodies, street_trees. Impervious surface is approximated (Toronto's authoritative layer ships only as a raster GeoTIFF).
Source: Toronto Treed Area + Ravine + Waterbodies + Street Tree Inventory
Enclosure / Eyes on Park
42 buildings within 25 m of the park edge (17 mid-rise, 17 low-rise, 8 tower); avg edge height 26.3 m (~9 floors); 13.4 buildings per 100 m of 314 m perimeter (strong frontage density); edges lean tall but still framed; 8 towers ≥ 40 m within 25 m of the edge. "Eyes on the park" come strongest from the 17 mid-rise edge buildings.
Source: Toronto 3D Massing (building footprints + heights)
Border Vacuum Risk
Park edges face the city. No significant border vacuum detected.
Source: Toronto Street Centreline (highways) + rail layer + OSM landuse + building footprints
Equity Context
Equity Context requires inputs not yet loaded for this park (Toronto Neighbourhood Profiles). Score is held at a neutral 50 with low confidence. Read with caution.
Source: Toronto Neighbourhood Profiles
Amenities (1 types · 1 records)
- playground
Nearby active-edge features (40)
- parking lot: Thompson House Parking66 m
- parking lot77 m
- parking lot85 m
- restaurant: Mantra by Host87 m
- parking lot: Reserved Parking90 m
- parking lot90 m
- parking lot91 m
- restaurant: Nomé Izakaya100 m
- transit stop: The Donway West at Clock Tower Rd North Side103 m
- community: Better Living Community Centre104 m
- retail: Anthropologie112 m
- restaurant: Bier Markt118 m
- parking lot120 m
- transit stop: The Donway West at Clock Tower Rd North Side123 m
- cafe: Tim Hortons127 m
- restaurant: Taylor's Landing127 m
- parking lot127 m
- transit stop: 1 Overland Dr at Taylor Place135 m
- retail: Hazukido138 m
- parking lot140 m
- parking lot: Church & Taylor Place Parking143 m
- restaurant: Joey148 m
- school: Seneca Hill Private School149 m
- parking lot151 m
- transit stop: 1050 Don Mills Rd - Shops On Don Mills154 m
- restaurant: Anejo158 m
- retail: L.L.Bean160 m
- parking lot160 m
- retail: LensCrafters163 m
- restaurant: Rock'n Deli172 m
- retail: Donato Salon & Spa174 m
- retail: YellowKorner180 m
- retail: Black Line Studio182 m
- retail: Metro188 m
- retail: Aphrodite Spa & Nails189 m
- retail: Pandora190 m
- retail: Freedom Mobile195 m
- retail: Northboys197 m
- retail: Azadi Jewellery198 m
- cafe: Tim Hortons199 m
Park profile
Five-axis radar across the structural dimensions.
Citywide percentile ranks
Across all Toronto parks in the dataset.
- Overall vitality61th
- Edge activation31th
- Connectivity58th
- Amenity diversity75th
- Natural comfort35th
- Enclosure84th
Most similar parks
Closest in metric space across the five structural dimensions.
- Glen Cedar ParkUrban Plaza36
- Turnberry North ParkUrban Plaza35
- Glen Ravine ParkRavine / Naturalized Park36
- Greenbrae ParketteUrban Plaza36
- TERRY FOX RECREATION CENTRE - Building GroundsNeighbourhood Park26
Most opposite parks
Furthest in metric space. Useful for recognising what kind of park this isn’t.
- Kew GardensNeighbourhood Park71
- Leslie Grove ParkParkette68
- Market Lane ParkUrban Plaza63
- Toronto ZooWaterfront Park57
- Mclevin Woods ParkRavine / Naturalized Park49
Human activity signals: not available
No activity signals have landed for this park yet. The model has scored its physical form but it can’t yet say how often it’s programmed, photographed, or walked through. See /data-ethics for what we will and will not collect.
Does this score feel accurate?
Your read of Don Mills Local Parkmatters. We’re testing whether the model lines up with how people actually use the park. Submissions are stored locally; no account needed.
Tell us how this park feels
We measure structure (canopy, edges, connectivity). You measure feeling. Both matter, and disagreement is itself useful civic data.
What would improve this park?
Generated from the weakest measured dimensions: a starting point, not a prescription.
- Activate the edges: encourage cafés, retail or community uses on the streets that face the park; replace blank or parking-lot edges where possible.
- Diversify what people can do in the park (playground, washroom, water, shade, performance, sport, garden): even small additions raise this score.
- Increase canopy and reduce paved area. Shade and water features extend usable hours and seasons.
Data sources
- City of Toronto Open Data: Parks (Green Space)Polygon boundaries, official names, types.
- Parks & Recreation FacilitiesInventory of in-park amenities (washrooms, fields, rinks…).
- Toronto Pedestrian NetworkSidewalk segments around and through parks; estimated park entrances.
- Toronto Centreline V2Street segments + intersection nodes near park edges; trails and walkways.
- Toronto 3D MassingBuilding footprints + heights for edge-building counts, frontage density, and tower-in-the-park risk.
- Toronto Treed AreaTree canopy share inside park polygons via stratified-grid sampling.
- Toronto Waterbodies & RiversWater surface inside parks + nearest-water distance for cooling.
- Ravine & Natural Feature ProtectionRavine overlap as a cooling / natural-comfort signal.
- Toronto Street Tree InventoryTree count + density inside park polygons.
- Neighbourhood Profiles(Pending) Equity context proxy.
- OpenStreetMap (Overpass API)Cafés, restaurants, retail, transit stops, parking, highways, rail.