St. Patricks Square
Civic Square, one of the city's strongest overall (score 55, rank ~98th percentile). Strongest: enclosure; weakest: natural comfort.
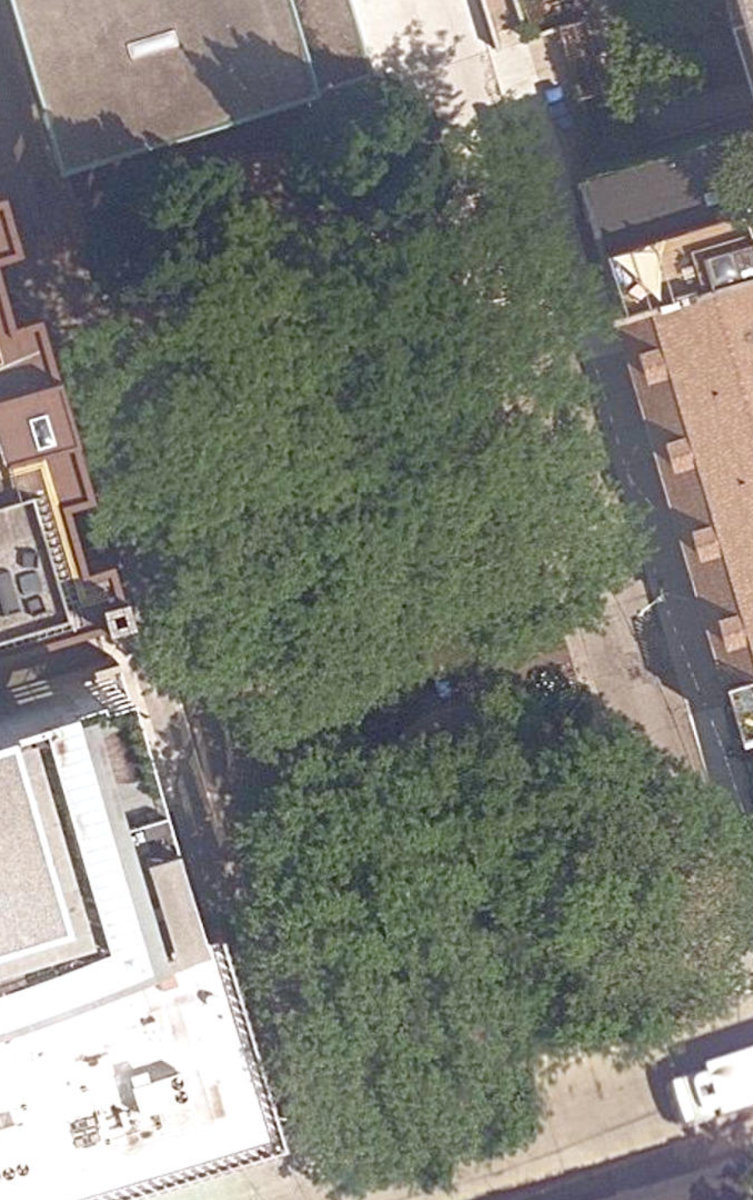
Aerial, City of Toronto orthophoto, ~8 cm/px source · cached 5/9/2026
St. Patricks Square scores 54.7 / 100. Strongest dimensions: enclosure / eyes on park and connectivity. Weakest: amenity diversity (0). Border-vacuum risk is low. This score is a transparent reading of Jane Jacobs-style vitality factors, not a definitive judgment.
Area · 0.07 ha
Weighted across six dimensions · confidence 57%
Scores are not bell-curved. Percentiles and expected scores provide context without changing the underlying model.
Loading map…
The parks map is loading.Explain this score
Where did the 55 come from? Each weighted contribution against a neutral 50 baseline. Green = pushed up; red = pulled down.
Sum of contributions = the headline score. A negative bar means that dimension dragged the park below the city-wide neutral baseline.
Why this park works
St. Patricks Square works because its enclosure score (96) is one of the city's strongest and its connectivity (78) is also top decile (32 mid-rise buildings frame the edge with passive surveillance).
What limits this park
St. Patricks Square doesn't have a clear weakness. Every measured dimension is at or above the middle of the pack.
Most distinctive characteristic
Most distinctive feature: exceptionally high enclosure (96, top decile).
Jacobs reading
St. Patricks Square sits between an urban social park and an ecological retreat: moderately useful for both, exceptionally suited to neither.
Tradeoffs
- Connectivity (78) significantly outpaces natural comfort (41): well placed in the city but offers little shade or ecological respite.
Performance in context
- This park is a strong overperformer for its cohort: raw 55 versus an expected 37 for similar parks (pocket Civic Square) (gap +18).
Typology classification
Classified as Civic Square: name flags as civic square + 49 buildings frame the edge. Secondary read: Urban Plaza (737 m², paved (0% canopy), 39.1 buildings/100 m).
Edge Activation
Within 100 m of the park edge: 35 active uses (retail, restaurant, transit_stop, cafe) and 4 dead/hostile uses (parking_lot). Active edges keep "eyes on the park" through the day; parking lots, blank institutional walls, rail and highway frontages drain street life.
Source: OSM POIs (amenity/shop) + Toronto Building Footprints + land use
Connectivity
Connectivity blends paths, intersections, transit, entrances, and edge density. This park has 14 mapped paths/walkways and 12 sidewalk segments within 50 m; 24 street intersections within 100 m; 18 transit stops within a 400 m walk; 6 estimated access points across ~125 m of perimeter. edge density is healthy, no superblock penalty. Source coverage: centreline, pedestrian_network, transit_osm.
Source: Toronto Centreline V2 + Pedestrian Network + OSM transit stops
Amenity Diversity
No amenities recorded. Score is 0 until inventory is loaded.
Source: Toronto Parks & Recreation Facilities + OSM amenity tags
Natural Comfort
Natural-comfort components for this park: ~8.4% effective canopy (0.0% from contiguous tree polygons + scattered tree density); nearest waterbody ~1339 m; 12 city-mapped trees inside the polygon (12.0/ha). Reading: exposed. Source coverage: waterbodies, street_trees. Impervious surface is approximated (Toronto's authoritative layer ships only as a raster GeoTIFF).
Source: Toronto Treed Area + Ravine + Waterbodies + Street Tree Inventory
Enclosure / Eyes on Park
49 buildings within 25 m of the park edge (32 mid-rise, 14 low-rise, 3 tower); avg edge height 17.2 m (~6 floors); 39.1 buildings per 100 m of 125 m perimeter (strong frontage density); edges are at a Jacobs-scale walkable mid-rise (3 to 7 floors); 3 towers ≥ 40 m within 25 m of the edge. "Eyes on the park" come strongest from the 32 mid-rise edge buildings.
Source: Toronto 3D Massing (building footprints + heights)
Border Vacuum Risk
Park edges face the city. No significant border vacuum detected.
Source: Toronto Street Centreline (highways) + rail layer + OSM landuse + building footprints
Equity Context
Equity Context requires inputs not yet loaded for this park (Toronto Neighbourhood Profiles). Score is held at a neutral 50 with low confidence. Read with caution.
Source: Toronto Neighbourhood Profiles
Amenities (0)
No amenities recorded for this park.
Nearby active-edge features (80)
- retail: Umbra35 m
- retail: New Tribe Tattooing and Piercings37 m
- retail: Get Me Fly39 m
- restaurant: Salad King40 m
- retail: Ye Perfect Nail & Spa40 m
- restaurant: Naan Kabob41 m
- retail: Queen Dry Cleaners41 m
- restaurant: Queen Street Warehouse42 m
- restaurant: Oh My Gyro!43 m
- retail: June Hairdresser On Fire45 m
- restaurant: Alpha’s Shawarma46 m
- retail: Dragon Vape47 m
- retail: BMV Books49 m
- restaurant: German Doner Kebab51 m
- retail: Tribal Rhythm52 m
- retail: New You Spa53 m
- retail: Aux Merveilleux54 m
- cafe: Nord Lyon Cafe56 m
- transit stop: John Street63 m
- cafe: Thor Espresso64 m
- transit stop: Stephanie Street65 m
- cafe: Tuck Shop Provisions67 m
- parking lot72 m
- retail: Star Vape72 m
- parking lot77 m
- retail: Gardenview Convenience78 m
- retail: OD82 m
- restaurant: Yakiniku Legend82 m
- transit stop: John Street85 m
- restaurant: Holy Cow Steakhouse86 m
- retail: Stag Shop86 m
- parking lot: MuchMusic/CTV Parking89 m
- retail: Civello Aveda90 m
- retail: Opteaq Eyecare91 m
- cafe: Mizzica Cafe92 m
- parking lot93 m
- restaurant: Korean Grill House94 m
- retail: Rendez Vous95 m
- retail: Scarpino97 m
- restaurant: Subway105 m
- restaurant: Aristos108 m
- restaurant: Queen Mother Cafe109 m
- retail: Man Stop Barber111 m
- retail: OCAD U Copy & Print Services112 m
- retail: Clearly112 m
- restaurant: Touhenboku Ramen113 m
- restaurant: Rudy115 m
- parking lot116 m
- restaurant: The Friar and Firkin116 m
- retail: Change117 m
- restaurant: Niuda117 m
- retail: Toni & Guy118 m
- restaurant: The Bombay119 m
- restaurant: Shah’s Halal Food121 m
- retail: The Hunny Pot122 m
- restaurant: Atomy124 m
- retail: St. Patrick's Mini Market124 m
- cafe: Tim Hortons124 m
- restaurant: Ikkousha Ramen124 m
- restaurant: Chipotle127 m
- restaurant: Little India128 m
- restaurant: Daily Press Juicery129 m
- restaurant: Ema-Tei Authentic Japanese Food130 m
- retail: So Hip131 m
- retail: Groovy132 m
- retail133 m
- restaurant: Sushi Time134 m
- retail: Hunny Pot Cannabis135 m
- restaurant: Ikkousha Ramen140 m
- restaurant: The Sandwich Table140 m
- retail: Kintaro Tattoo144 m
- restaurant: Chick Queen144 m
- retail: Cori145 m
- cafe: HotBlack Coffee147 m
- cafe: Wonder Pet Cafe152 m
- parking lot157 m
- retail: LCBO157 m
- restaurant: Carlotta Bar158 m
- restaurant: The Fifth Gastropub161 m
- restaurant: The Rex Jazz & Blues Bar161 m
Park profile
Five-axis radar across the structural dimensions.
Citywide percentile ranks
Across all Toronto parks in the dataset.
- Overall vitality98th
- Edge activation97th
- Connectivity98th
- Amenity diversity41th
- Natural comfort39th
- Enclosure99th
Most similar parks
Closest in metric space across the five structural dimensions.
- Anniversary ParkUrban Plaza56
- Hubbard ParkParkette50
- Jesse Ketchum ParkUrban Plaza51
- Massey Harris ParkUrban Plaza57
- Cathedral Church Of St. JamesParkette47
Most opposite parks
Furthest in metric space. Useful for recognising what kind of park this isn’t.
- Toronto Islands - Muggs Island ParkRavine / Naturalized Park25
- Trca Lands ( 26)Ravine / Naturalized Park27
- Rouge ParkWaterfront Park25
- Rouge ParkRavine / Naturalized Park28
- Rouge ParkRavine / Naturalized Park21
Human activity signals: not available
No activity signals have landed for this park yet. The model has scored its physical form but it can’t yet say how often it’s programmed, photographed, or walked through. See /data-ethics for what we will and will not collect.
Does this score feel accurate?
Your read of St. Patricks Squarematters. We’re testing whether the model lines up with how people actually use the park. Submissions are stored locally; no account needed.
Tell us how this park feels
We measure structure (canopy, edges, connectivity). You measure feeling. Both matter, and disagreement is itself useful civic data.
What would improve this park?
Generated from the weakest measured dimensions: a starting point, not a prescription.
- Diversify what people can do in the park (playground, washroom, water, shade, performance, sport, garden): even small additions raise this score.
- Increase canopy and reduce paved area. Shade and water features extend usable hours and seasons.
Data sources
- City of Toronto Open Data: Parks (Green Space)Polygon boundaries, official names, types.
- Parks & Recreation FacilitiesInventory of in-park amenities (washrooms, fields, rinks…).
- Toronto Pedestrian NetworkSidewalk segments around and through parks; estimated park entrances.
- Toronto Centreline V2Street segments + intersection nodes near park edges; trails and walkways.
- Toronto 3D MassingBuilding footprints + heights for edge-building counts, frontage density, and tower-in-the-park risk.
- Toronto Treed AreaTree canopy share inside park polygons via stratified-grid sampling.
- Toronto Waterbodies & RiversWater surface inside parks + nearest-water distance for cooling.
- Ravine & Natural Feature ProtectionRavine overlap as a cooling / natural-comfort signal.
- Toronto Street Tree InventoryTree count + density inside park polygons.
- Neighbourhood Profiles(Pending) Equity context proxy.
- OpenStreetMap (Overpass API)Cafés, restaurants, retail, transit stops, parking, highways, rail.