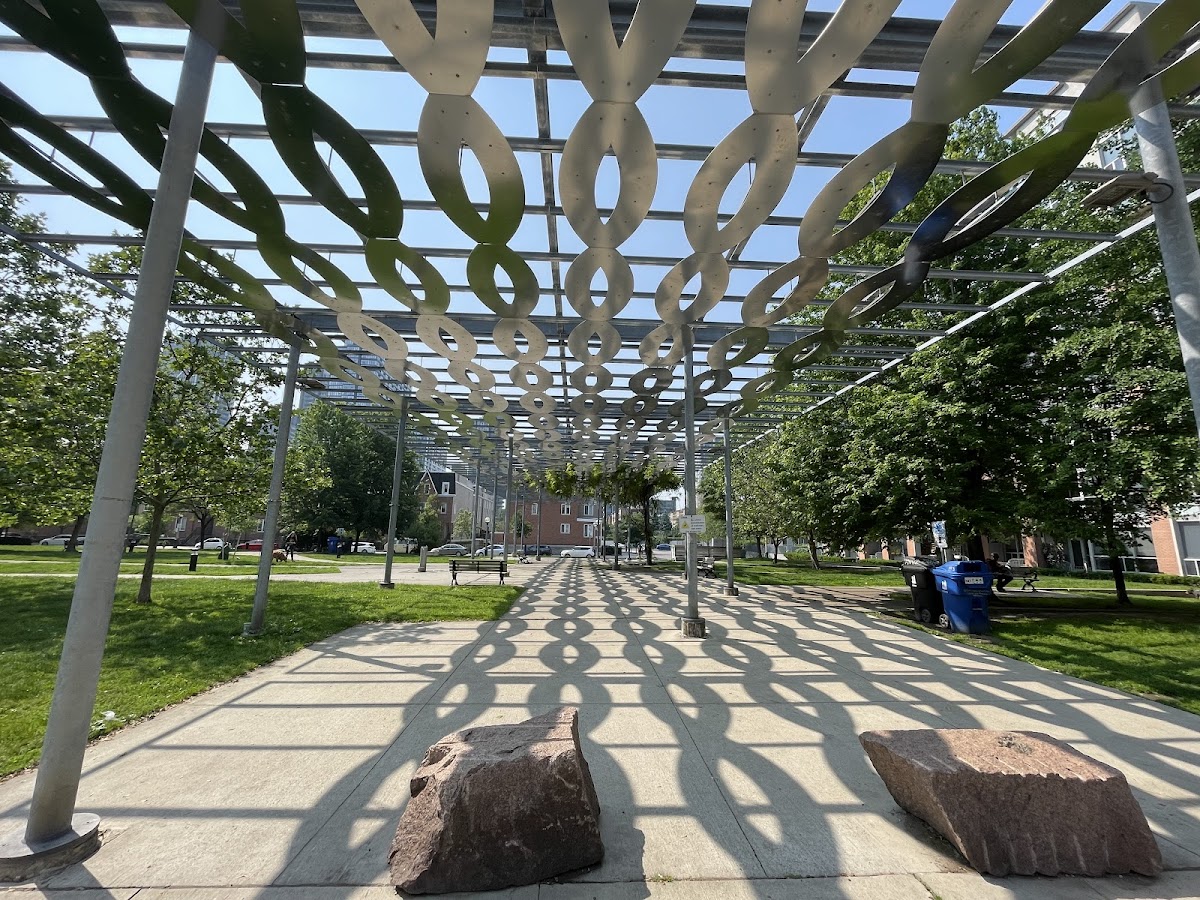
Massey Harris Park
Urban Plaza, one of the city's strongest overall (score 57, rank ~99th percentile). Strongest: connectivity; weakest: natural comfort.
Photo by Darcy via Google Places · cached 5/9/2026
Massey Harris Park scores 56.5 / 100. Strongest dimensions: enclosure / eyes on park and connectivity. Weakest: amenity diversity (0). Border-vacuum risk is low. This score is a transparent reading of Jane Jacobs-style vitality factors, not a definitive judgment.
Area · 0.33 ha
Weighted across six dimensions · confidence 57%
Scores are not bell-curved. Percentiles and expected scores provide context without changing the underlying model.
Loading map…
The parks map is loading.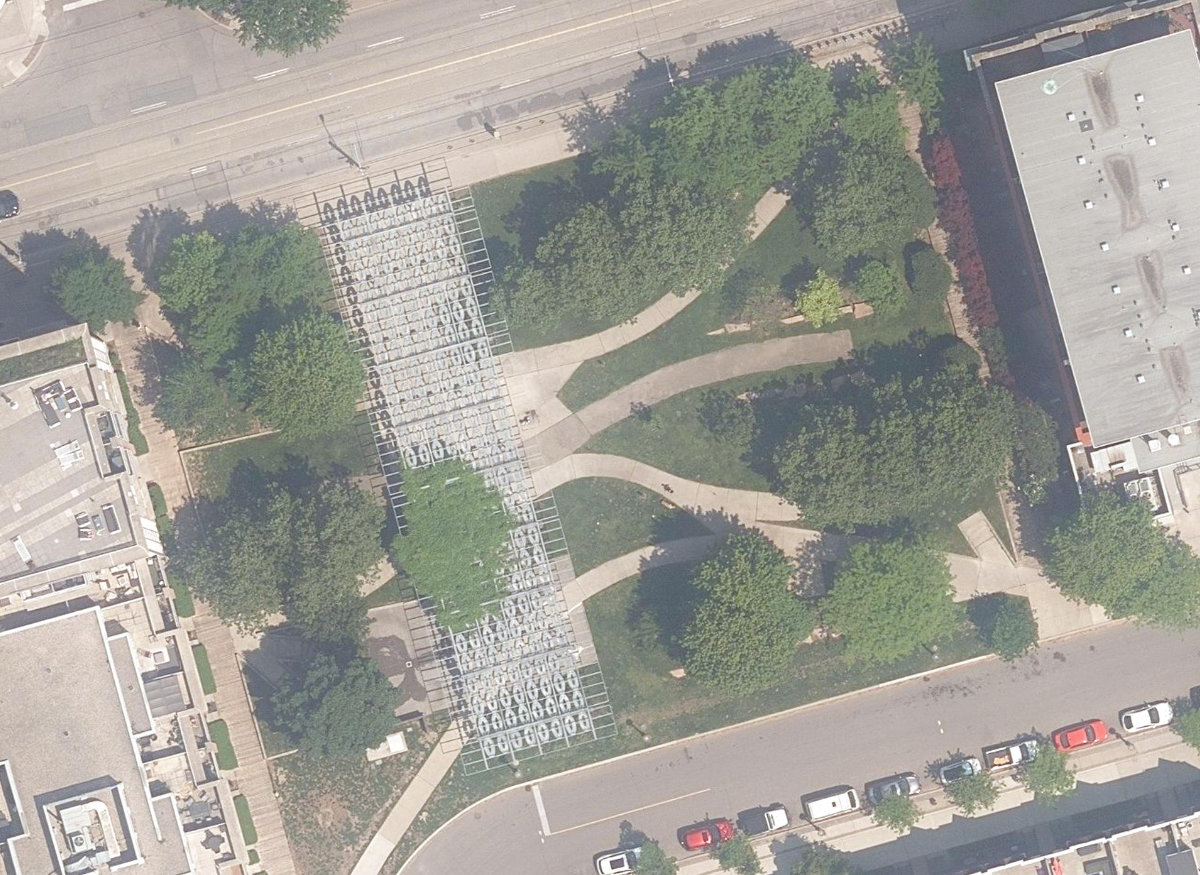
Explain this score
Where did the 57 come from? Each weighted contribution against a neutral 50 baseline. Green = pushed up; red = pulled down.
Sum of contributions = the headline score. A negative bar means that dimension dragged the park below the city-wide neutral baseline.
Why this park works
Massey Harris Park works because its connectivity score (80) is one of the city's strongest and its edge activation (65) is also top decile (17 transit stops sit within a 400 m walk; 14 intersections fall within 100 m of the edge).
What limits this park
Massey Harris Park is held back by natural comfort (36, below-average): only 0% canopy means little summer shade.
Most distinctive characteristic
Most distinctive feature: exceptionally high connectivity (80, top decile).
Jacobs reading
Massey Harris Park sits between an urban social park and an ecological retreat: moderately useful for both, exceptionally suited to neither.
Tradeoffs
- Connectivity (80) significantly outpaces natural comfort (36): well placed in the city but offers little shade or ecological respite.
Performance in context
- This park is a strong overperformer for its cohort: raw 57 versus an expected 39 for similar parks (small Urban Plaza) (gap +18).
Typology classification
Classified as Urban Plaza: 3345 m², paved (0% canopy), 9.9 buildings/100 m
Edge Activation
Within 100 m of the park edge: 16 active uses (restaurant, transit_stop, cafe, retail) and 1 dead/hostile uses (rail). Active edges keep "eyes on the park" through the day; parking lots, blank institutional walls, rail and highway frontages drain street life.
Source: OSM POIs (amenity/shop) + Toronto Building Footprints + land use
Connectivity
Connectivity blends paths, intersections, transit, entrances, and edge density. This park has 28 mapped paths/walkways and 23 sidewalk segments within 50 m; 14 street intersections within 100 m; 17 transit stops within a 400 m walk; 12 estimated access points across ~242 m of perimeter. edge density is healthy, no superblock penalty. Source coverage: centreline, pedestrian_network, transit_osm.
Source: Toronto Centreline V2 + Pedestrian Network + OSM transit stops
Amenity Diversity
No amenities recorded. Score is 0 until inventory is loaded.
Source: Toronto Parks & Recreation Facilities + OSM amenity tags
Natural Comfort
Natural-comfort components for this park: ~2.8% effective canopy (0.0% from contiguous tree polygons + scattered tree density); nearest waterbody ~1005 m; 4 city-mapped trees inside the polygon (4.0/ha). Reading: exposed. Source coverage: waterbodies, street_trees. Impervious surface is approximated (Toronto's authoritative layer ships only as a raster GeoTIFF).
Source: Toronto Treed Area + Ravine + Waterbodies + Street Tree Inventory
Enclosure / Eyes on Park
24 buildings within 25 m of the park edge (20 mid-rise, 2 low-rise, 2 tower); avg edge height 18.7 m (~6 floors); 9.9 buildings per 100 m of 242 m perimeter (strong frontage density); edges are at a Jacobs-scale walkable mid-rise (3 to 7 floors); 2 towers ≥ 40 m within 25 m of the edge. "Eyes on the park" come strongest from the 20 mid-rise edge buildings.
Source: Toronto 3D Massing (building footprints + heights)
Border Vacuum Risk
Park edges face the city. No significant border vacuum detected.
Source: Toronto Street Centreline (highways) + rail layer + OSM landuse + building footprints
Equity Context
Equity Context requires inputs not yet loaded for this park (Toronto Neighbourhood Profiles). Score is held at a neutral 50 with low confidence. Read with caution.
Source: Toronto Neighbourhood Profiles
Amenities (0)
No amenities recorded for this park.
Nearby active-edge features (54)
- retail: MD Skin Lab7 m
- retail: Woof Gang Bakery & Grooming15 m
- retail26 m
- retail: King West Village Cleaners37 m
- retail: Organic Nail Bar51 m
- transit stop: King Street West57 m
- retail: JustCare Cosmetics58 m
- retail: Sparks Salon63 m
- retail: Wine Rack63 m
- restaurant: King Rustic Kitchen & Bar70 m
- retail: King West Eye Care73 m
- transit stop: Strachan Avenue75 m
- transit stop: Canniff Street76 m
- cafe: Starbucks79 m
- transit stop: Shaw Street79 m
- rail89 m
- transit stop: Shaw Street96 m
- transit stop: Strachan Avenue104 m
- restaurant: Pizza Nova104 m
- transit stop: Wellington Street West107 m
- transit stop: Shaw Street107 m
- rail107 m
- rail: Union Station Rail Corridor109 m
- rail: Union Station Rail Corridor112 m
- restaurant: Ali Baba's113 m
- retail: No Frills115 m
- restaurant: My Roti Place120 m
- rail: Union Station Rail Corridor121 m
- cafe: The Coffee127 m
- parking lot132 m
- restaurant: Grandma Loves You133 m
- retail135 m
- rail: Union Station Rail Corridor136 m
- parking lot136 m
- rail: Union Station Rail Corridor136 m
- retail: A&A Auto Garage138 m
- rail141 m
- retail: Mobizone145 m
- retail: Spadina Auto Service149 m
- parking lot150 m
- restaurant: Thai Room151 m
- restaurant: Burritoz157 m
- retail: Sixth Sense Spa & Nail Lounge158 m
- retail: King West Nails and Spa158 m
- retail: King Barberia163 m
- retail171 m
- transit stop: Adelaide Street West173 m
- retail: DashMart by DoorDash173 m
- parking lot174 m
- retail: Benjamin Moore179 m
- retail179 m
- retail: Assured Collision Centre189 m
- transit stop: Adelaide Street West191 m
- retail: Sleep Country195 m
Park profile
Five-axis radar across the structural dimensions.
Citywide percentile ranks
Across all Toronto parks in the dataset.
- Overall vitality99th
- Edge activation99th
- Connectivity99th
- Amenity diversity40th
- Natural comfort25th
- Enclosure95th
Most similar parks
Closest in metric space across the five structural dimensions.
- Anniversary ParkUrban Plaza56
- Asquith Green ParkUrban Plaza55
- Norman Jewison ParkUrban Plaza57
- St. Patricks SquareCivic Square55
- Jesse Ketchum ParkUrban Plaza51
Most opposite parks
Furthest in metric space. Useful for recognising what kind of park this isn’t.
- Trca Lands ( 26)Ravine / Naturalized Park27
- Toronto Islands - Muggs Island ParkRavine / Naturalized Park25
- Rouge ParkRavine / Naturalized Park28
- Rouge ParkWaterfront Park25
- Rouge ParkRavine / Naturalized Park26
Visitor signals
Public attention measured by Google Places aggregates. This proxies attention, not occupancy. Aggregate-only: no usernames, no review text, no extra photos beyond the cached hero.
p69 citywide · p73 within Urban Plaza
Source: Google Places API · match unverified (0.00 composite confidence) · last refreshed 5/9/2026. Privacy contract. Measures public attention, not occupancy.
Human activity signals: not available
No activity signals have landed for this park yet. The model has scored its physical form but it can’t yet say how often it’s programmed, photographed, or walked through. See /data-ethics for what we will and will not collect.
Does this score feel accurate?
Your read of Massey Harris Parkmatters. We’re testing whether the model lines up with how people actually use the park. Submissions are stored locally; no account needed.
Tell us how this park feels
We measure structure (canopy, edges, connectivity). You measure feeling. Both matter, and disagreement is itself useful civic data.
What would improve this park?
Generated from the weakest measured dimensions: a starting point, not a prescription.
- Diversify what people can do in the park (playground, washroom, water, shade, performance, sport, garden): even small additions raise this score.
- Increase canopy and reduce paved area. Shade and water features extend usable hours and seasons.
Data sources
- City of Toronto Open Data: Parks (Green Space)Polygon boundaries, official names, types.
- Parks & Recreation FacilitiesInventory of in-park amenities (washrooms, fields, rinks…).
- Toronto Pedestrian NetworkSidewalk segments around and through parks; estimated park entrances.
- Toronto Centreline V2Street segments + intersection nodes near park edges; trails and walkways.
- Toronto 3D MassingBuilding footprints + heights for edge-building counts, frontage density, and tower-in-the-park risk.
- Toronto Treed AreaTree canopy share inside park polygons via stratified-grid sampling.
- Toronto Waterbodies & RiversWater surface inside parks + nearest-water distance for cooling.
- Ravine & Natural Feature ProtectionRavine overlap as a cooling / natural-comfort signal.
- Toronto Street Tree InventoryTree count + density inside park polygons.
- Neighbourhood Profiles(Pending) Equity context proxy.
- OpenStreetMap (Overpass API)Cafés, restaurants, retail, transit stops, parking, highways, rail.