Queen'S Park
Neighbourhood Park, middle of the pack overall (score 33, rank ~43th percentile). Strongest: connectivity; weakest: edge activation.
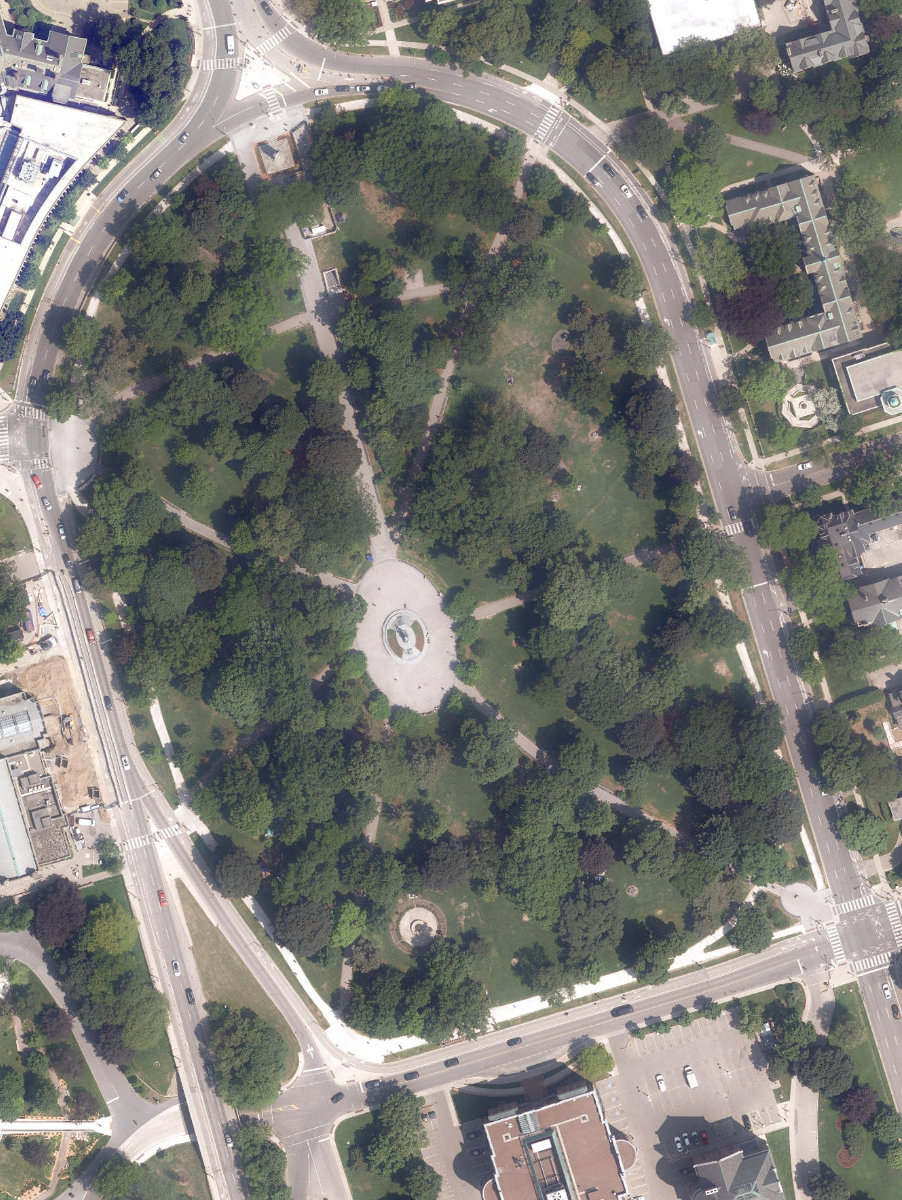
Aerial, City of Toronto orthophoto, ~8 cm/px source · cached 5/9/2026
Queen'S Park scores 32.6 / 100. Strongest dimensions: connectivity and enclosure / eyes on park. Weakest: amenity diversity (0). Border-vacuum risk is elevated (100). This score is a transparent reading of Jane Jacobs-style vitality factors, not a definitive judgment.
Area · 5.14 ha
Weighted across six dimensions · confidence 61%
Scores are not bell-curved. Percentiles and expected scores provide context without changing the underlying model.
Loading map…
The parks map is loading.Explain this score
Where did the 33 come from? Each weighted contribution against a neutral 50 baseline. Green = pushed up; red = pulled down.
Sum of contributions = the headline score. A negative bar means that dimension dragged the park below the city-wide neutral baseline.
Why this park works
Queen'S Park works because its connectivity score (84) is one of the city's strongest and its enclosure (83) is also top quartile (36 transit stops sit within a 400 m walk; 16 intersections fall within 100 m of the edge).
What limits this park
Queen'S Park is held back by edge activation (0, below-average): the surrounding streets carry too few active uses to spill into the park; border-vacuum risk is also elevated (100).
Most distinctive characteristic
Most distinctive feature: exceptionally high connectivity (84, top decile).
Jacobs reading
Queen'S Park sits between an urban social park and an ecological retreat: moderately useful for both, exceptionally suited to neither.
Tradeoffs
- Connectivity (84) significantly outpaces natural comfort (49): well placed in the city but offers little shade or ecological respite.
- The park is enclosed by buildings (83) but the surrounding streets are quiet (edge activation 0): frame without animation.
- High connectivity coexists with high border-vacuum risk (100): much of that connectivity is to highways, rail, or parking lots, not to neighbourhoods.
Typology classification
Classified as Neighbourhood Park: 5.1 ha, framed by 36 mid-rise vs 0 towers
Edge Activation
Within 100 m of the park edge: 12 active uses (transit_stop, restaurant, community, cafe) and 20 dead/hostile uses (highway, parking_lot). Active edges keep "eyes on the park" through the day; parking lots, blank institutional walls, rail and highway frontages drain street life.
Source: OSM POIs (amenity/shop) + Toronto Building Footprints + land use
Connectivity
Connectivity blends paths, intersections, transit, entrances, and edge density. This park has 42 mapped paths/walkways and 75 sidewalk segments within 50 m; 16 street intersections within 100 m; 36 transit stops within a 400 m walk; 24 estimated access points across ~1,027 m of perimeter. edge density is healthy, no superblock penalty. Source coverage: centreline, pedestrian_network, transit_osm.
Source: Toronto Centreline V2 + Pedestrian Network + OSM transit stops
Amenity Diversity
No amenities recorded. Score is 0 until inventory is loaded.
Source: Toronto Parks & Recreation Facilities + OSM amenity tags
Natural Comfort
Natural-comfort components for this park: ~18.1% effective canopy (1.5% from contiguous tree polygons + scattered tree density); 133 city-mapped trees inside the polygon (25.9/ha). Reading: exposed. Source coverage: treed_area, street_trees. Impervious surface is approximated (Toronto's authoritative layer ships only as a raster GeoTIFF).
Source: Toronto Treed Area + Ravine + Waterbodies + Street Tree Inventory
Enclosure / Eyes on Park
46 buildings within 25 m of the park edge (36 mid-rise, 10 low-rise, 0 tower); avg edge height 14.1 m (~5 floors); 4.5 buildings per 100 m of 1,027 m perimeter (strong frontage density); edges are at a Jacobs-scale walkable mid-rise (3 to 7 floors); no towers immediately adjacent. "Eyes on the park" come strongest from the 36 mid-rise edge buildings.
Source: Toronto 3D Massing (building footprints + heights)
Border Vacuum Risk
Border-vacuum factors within 50 m of the park: Queen's Park Crescent West, Queen's Park Crescent West, Queen's Park, Queen's Park, Queen's Park Crescent West, Queen's Park Crescent West, Queen's Park Crescent West, Queen's Park Crescent East, parking_lot, Queen's Park Crescent East, Queen's Park Crescent East. Jacobs warned that highways, rail, parking lots and blank institutional edges act as "vacuums" that suppress foot traffic and isolate the park from its neighbourhood.
Source: Toronto Street Centreline (highways) + rail layer + OSM landuse + building footprints
Equity Context
Equity Context requires inputs not yet loaded for this park (Toronto Neighbourhood Profiles). Score is held at a neutral 50 with low confidence. Read with caution.
Source: Toronto Neighbourhood Profiles
Amenities (0)
No amenities recorded for this park.
Nearby active-edge features (62)
- transit stop0 m
- highway: Queen's Park Crescent East0 m
- highway: Queen's Park Crescent West3 m
- highway: Queen's Park Crescent West5 m
- highway: Queen's Park Crescent West6 m
- highway: Queen's Park Crescent East6 m
- highway: Queen's Park Crescent East8 m
- highway: Queen's Park Crescent West12 m
- transit stop: Queen's Part Cres West at Hart House13 m
- highway: Queen's Park Crescent West13 m
- transit stop: Queen's Park Cres East at St Joseph St North Side15 m
- transit stop: Hoskin Avenue17 m
- transit stop: Wellesley Street West19 m
- highway: Queen's Park26 m
- highway: Queen's Park26 m
- transit stop: Queen's Park Crescent East29 m
- parking lot30 m
- cafe: Terima Coffee + Pantry Bar32 m
- transit stop: Queen's Park Crescent East42 m
- transit stop: Queen's Part Cres East at Wellesley St West47 m
- highway: Queen's Park Crescent West50 m
- parking lot50 m
- community: Regis College Library54 m
- parking lot58 m
- parking lot60 m
- parking lot63 m
- parking lot64 m
- community: Emmanuel College Library - Victoria University65 m
- parking lot84 m
- parking lot87 m
- restaurant: The Arbor Room94 m
- highway: Queen's Park100 m
- transit stop: Museum102 m
- transit stop: Museum103 m
- community: Hart House Library116 m
- highway: Queen's Park Crescent East117 m
- parking lot118 m
- cafe: Caffiends119 m
- transit stop: Queens Park East Side122 m
- parking lot123 m
- transit stop: Queens Park West Side129 m
- retail: Gateway Newsstands131 m
- transit stop: Queens Park East Side133 m
- cafe: Acacia Cafe133 m
- parking lot135 m
- retail: Understudy Cafe136 m
- parking lot137 m
- highway: Queen's Park Crescent West141 m
- parking lot144 m
- parking lot146 m
- cafe: Kelly's Cafe147 m
- transit stop: Tower Road155 m
- transit stop: Queens Park West Side158 m
- community: University College Library164 m
- community: Music Library166 m
- parking lot171 m
- transit stop: Tower Road172 m
- parking lot182 m
- restaurant: Ned's Cafe189 m
- parking lot193 m
- parking lot197 m
- parking lot199 m
Park profile
Five-axis radar across the structural dimensions.
Citywide percentile ranks
Across all Toronto parks in the dataset.
- Overall vitality43th
- Edge activation26th
- Connectivity100th
- Amenity diversity35th
- Natural comfort58th
- Enclosure89th
Most similar parks
Closest in metric space across the five structural dimensions.
- Alexander Muir Memorial GardensCivic Square33
- St. James CemeteryRavine / Naturalized Park39
- West Toronto Rail PathCorridor / Linear Park31
- Duplex ParketteRavine / Naturalized Park32
- Kay Gardner Beltline ParkRavine / Naturalized Park35
Most opposite parks
Furthest in metric space. Useful for recognising what kind of park this isn’t.
- Toronto Islands - Muggs Island ParkRavine / Naturalized Park25
- Trca Lands ( 26)Ravine / Naturalized Park27
- Rouge ParkRavine / Naturalized Park21
- Rouge ParkWaterfront Park25
- Rouge ParkRavine / Naturalized Park26
Human activity signals: not available
No activity signals have landed for this park yet. The model has scored its physical form but it can’t yet say how often it’s programmed, photographed, or walked through. See /data-ethics for what we will and will not collect.
Does this score feel accurate?
Your read of Queen'S Parkmatters. We’re testing whether the model lines up with how people actually use the park. Submissions are stored locally; no account needed.
Tell us how this park feels
We measure structure (canopy, edges, connectivity). You measure feeling. Both matter, and disagreement is itself useful civic data.
What would improve this park?
Generated from the weakest measured dimensions: a starting point, not a prescription.
- Activate the edges: encourage cafés, retail or community uses on the streets that face the park; replace blank or parking-lot edges where possible.
- Diversify what people can do in the park (playground, washroom, water, shade, performance, sport, garden): even small additions raise this score.
- Increase canopy and reduce paved area. Shade and water features extend usable hours and seasons.
- Mitigate border vacuums (highways, rail, parking) with active programming on the still-permeable edges and treat the hostile edge as a design challenge.
Data sources
- City of Toronto Open Data: Parks (Green Space)Polygon boundaries, official names, types.
- Parks & Recreation FacilitiesInventory of in-park amenities (washrooms, fields, rinks…).
- Toronto Pedestrian NetworkSidewalk segments around and through parks; estimated park entrances.
- Toronto Centreline V2Street segments + intersection nodes near park edges; trails and walkways.
- Toronto 3D MassingBuilding footprints + heights for edge-building counts, frontage density, and tower-in-the-park risk.
- Toronto Treed AreaTree canopy share inside park polygons via stratified-grid sampling.
- Toronto Waterbodies & RiversWater surface inside parks + nearest-water distance for cooling.
- Ravine & Natural Feature ProtectionRavine overlap as a cooling / natural-comfort signal.
- Toronto Street Tree InventoryTree count + density inside park polygons.
- Neighbourhood Profiles(Pending) Equity context proxy.
- OpenStreetMap (Overpass API)Cafés, restaurants, retail, transit stops, parking, highways, rail.