Christie Pits Park
Ravine / Naturalized Park, in the top tier overall (score 44, rank ~87th percentile). Strongest: connectivity; weakest: edge activation.
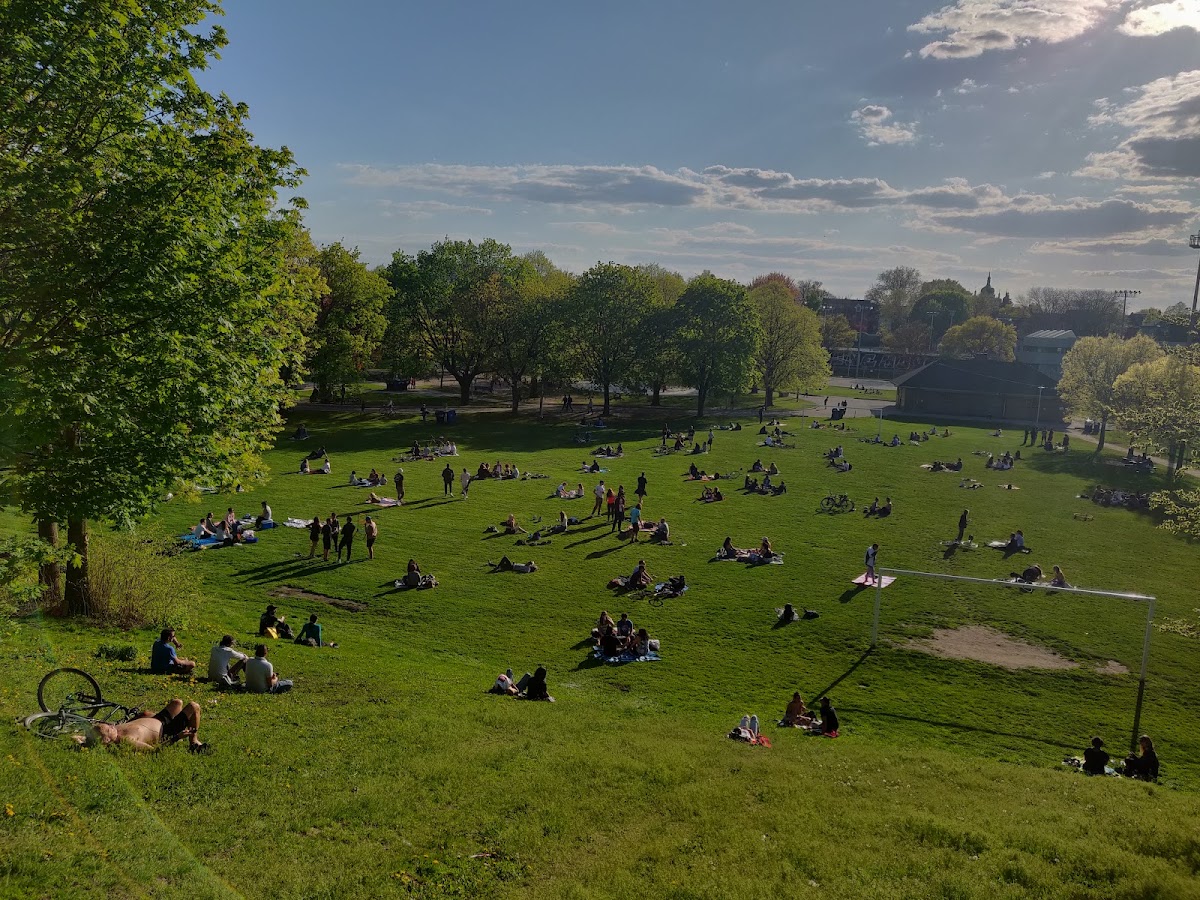
Photo by Daniel Puiatti via Google Places · cached 5/9/2026
Christie Pits Park scores 43.9 / 100. Strongest dimensions: connectivity and enclosure / eyes on park. Weakest: edge activation (0). Border-vacuum risk is elevated (100). This score is a transparent reading of Jane Jacobs-style vitality factors, not a definitive judgment.
Area · 8.83 ha
Weighted across six dimensions · confidence 68%
Scores are not bell-curved. Percentiles and expected scores provide context without changing the underlying model.
Loading map…
The parks map is loading.
Explain this score
Where did the 44 come from? Each weighted contribution against a neutral 50 baseline. Green = pushed up; red = pulled down.
Sum of contributions = the headline score. A negative bar means that dimension dragged the park below the city-wide neutral baseline.
Why this park works
Christie Pits Park works because its connectivity score (87) is one of the city's strongest and its amenity diversity (48) is also top decile (28 transit stops sit within a 400 m walk; 40 intersections fall within 100 m of the edge).
What limits this park
Christie Pits Park is held back by edge activation (0, below-average): the surrounding streets carry too few active uses to spill into the park; border-vacuum risk is also elevated (100).
Most distinctive characteristic
Most distinctive feature: exceptionally high connectivity (87, top decile).
Jacobs reading
Christie Pits Park sits between an urban social park and an ecological retreat: moderately useful for both, exceptionally suited to neither.
Tradeoffs
- Connectivity (87) significantly outpaces natural comfort (59): well placed in the city but offers little shade or ecological respite.
- The park is enclosed by buildings (80) but the surrounding streets are quiet (edge activation 0): frame without animation.
- High connectivity coexists with high border-vacuum risk (100): much of that connectivity is to highways, rail, or parking lots, not to neighbourhoods.
Performance in context
- A modest overperformer for its ravine / naturalized park typology (+8 vs the median in large Ravine / Naturalized Park ravine).
Typology classification
Classified as Ravine / Naturalized Park: 86% ravine overlap, 0% canopy. Secondary read: Athletic / Recreation Park (57% of amenity types are athletic (basketball, skatepark, sports_field, tennis)).
Edge Activation
Within 100 m of the park edge: 57 active uses (restaurant, retail, cafe, transit_stop, school, community) and 18 dead/hostile uses (highway, parking_lot, rail). Active edges keep "eyes on the park" through the day; parking lots, blank institutional walls, rail and highway frontages drain street life.
Source: OSM POIs (amenity/shop) + Toronto Building Footprints + land use
Connectivity
Connectivity blends paths, intersections, transit, entrances, and edge density. This park has 51 mapped paths/walkways and 105 sidewalk segments within 50 m; 40 street intersections within 100 m; 28 transit stops within a 400 m walk; 26 estimated access points across ~1,392 m of perimeter. edge density is healthy, no superblock penalty. Source coverage: centreline, pedestrian_network, transit_osm.
Source: Toronto Centreline V2 + Pedestrian Network + OSM transit stops
Amenity Diversity
7 distinct amenity types in the park (basketball, picnic, playground, skatepark, sports_field, tennis, …). Diversity, not raw count, drives the score so a park with many distinct activity types can outrank a larger park that repeats the same use.
Source: Toronto Parks & Recreation Facilities + OSM amenity tags
Natural Comfort
Natural-comfort components for this park: ~12.1% effective canopy (0.0% from contiguous tree polygons + scattered tree density); 85.9% inside the ravine system; nearest waterbody ~1394 m; 153 city-mapped trees inside the polygon (17.3/ha). Reading: ravine-cooled. Source coverage: ravine, waterbodies, street_trees. Impervious surface is approximated (Toronto's authoritative layer ships only as a raster GeoTIFF).
Source: Toronto Treed Area + Ravine + Waterbodies + Street Tree Inventory
Enclosure / Eyes on Park
259 buildings within 25 m of the park edge (35 mid-rise, 224 low-rise, 0 tower); avg edge height 7.5 m (~3 floors); 18.6 buildings per 100 m of 1,392 m perimeter (strong frontage density); edges are low-rise (mostly 2 to 3 floors); no towers immediately adjacent. "Eyes on the park" come strongest from the 35 mid-rise edge buildings.
Source: Toronto 3D Massing (building footprints + heights)
Border Vacuum Risk
Border-vacuum factors within 50 m of the park: Bloor Street West, parking_lot, Bloor Street West, Bloor Street West, Bloor Street West, Bloor Street West, Bloor Street West, parking_lot, Bloor Street West, Bloor Street West, Bloor Street West, Bloor Street West, Bloor Street West, parking_lot. Jacobs warned that highways, rail, parking lots and blank institutional edges act as "vacuums" that suppress foot traffic and isolate the park from its neighbourhood.
Source: Toronto Street Centreline (highways) + rail layer + OSM landuse + building footprints
Equity Context
Equity Context requires inputs not yet loaded for this park (Toronto Neighbourhood Profiles). Score is held at a neutral 50 with low confidence. Read with caution.
Source: Toronto Neighbourhood Profiles
Amenities (7 types · 7 records)
- basketball
- picnic
- playground
- skatepark
- sports field
- tennis
- washroom
Nearby active-edge features (80)
- parking lot0 m
- transit stop: Barton Avenue0 m
- restaurant: Madras Masala5 m
- highway: Bloor Street West8 m
- highway: Bloor Street West8 m
- highway: Bloor Street West8 m
- transit stop8 m
- highway: Bloor Street West9 m
- highway: Bloor Street West9 m
- highway: Bloor Street West10 m
- highway: Bloor Street West10 m
- highway: Bloor Street West11 m
- restaurant: Banjara Indian Cuisine13 m
- parking lot15 m
- transit stop18 m
- retail: My 151 Convenience20 m
- retail: Kompas Express Tour Operator22 m
- retail22 m
- retail: Goldspell23 m
- transit stop23 m
- highway: Bloor Street West23 m
- highway: Bloor Street West26 m
- transit stop: Christie Station32 m
- restaurant: Simple Burger33 m
- restaurant: Lamhan36 m
- transit stop: Christie Street36 m
- parking lot36 m
- retail38 m
- retail: Tess Hair Salon40 m
- restaurant: Subway40 m
- highway: Bloor Street West40 m
- restaurant: Shawarma Daddy43 m
- retail: Millicent45 m
- retail: Christie Convenience46 m
- retail: Doctor Mac47 m
- cafe: Chantecler47 m
- community: Korean Senior Citizens Centre47 m
- retail: Green Hair Salon48 m
- restaurant: Gochu Libre48 m
- transit stop: Christie49 m
- cafe: Hello Coffee50 m
- cafe: Tim Hortons51 m
- transit stop: Christie51 m
- retail: Goa Lash Studio54 m
- restaurant: Kernels Popcorn55 m
- retail: Ba Noi61 m
- parking lot61 m
- retail: Cowlick61 m
- restaurant: The Manna63 m
- retail: Cheques Cashed67 m
- restaurant: Fresh Habesha67 m
- retail: Sebang Travel KC Tours69 m
- retail70 m
- rail: Bloor-Danforth Line72 m
- restaurant: Latin World73 m
- restaurant: Selam Restaurant & Lounge74 m
- highway: Bloor Street West75 m
- retail: The UPS Store75 m
- retail77 m
- restaurant: Christie Pits Pub79 m
- retail: Joo Beauty Salon83 m
- retail: Goa Hair Salon84 m
- school: West End Alternative Secondary School86 m
- retail: D&W Wellness86 m
- restaurant: Sinjeon87 m
- retail: Bark & Meow Pet Supplies89 m
- retail: M&Lash90 m
- retail: Clarisse Hair Salon91 m
- restaurant: Yummy Korean Restaurant93 m
- restaurant: Morellina’s94 m
- parking lot95 m
- retail: Joanne & Beauty Co.95 m
- retail96 m
- restaurant: Gorhe Gorhe Karaoke98 m
- retail: Toronto Gold100 m
- restaurant: Mapo Korean Restaurant101 m
- retail: good juice box105 m
- retail: Freta Injera & Variety Store105 m
- restaurant: Riki Sushi109 m
- retail: Infinity Nail Bar111 m
Park profile
Five-axis radar across the structural dimensions.
Citywide percentile ranks
Across all Toronto parks in the dataset.
- Overall vitality87th
- Edge activation33th
- Connectivity100th
- Amenity diversity100th
- Natural comfort74th
- Enclosure84th
Most similar parks
Closest in metric space across the five structural dimensions.
- Earlscourt ParkNeighbourhood Park44
- Monarch ParkNeighbourhood Park45
- Tom Riley ParkWaterfront Park40
- Oriole Park - TorontoNeighbourhood Park42
- Riverdale Park WestRavine / Naturalized Park46
Most opposite parks
Furthest in metric space. Useful for recognising what kind of park this isn’t.
- Toronto Islands - Muggs Island ParkRavine / Naturalized Park25
- Rouge ParkRavine / Naturalized Park21
- Rouge ParkRavine / Naturalized Park18
- Trca Lands ( 26)Ravine / Naturalized Park27
- Trca Lands ( 58)Waterfront Park18
Visitor signals
Public attention measured by Google Places aggregates. This proxies attention, not occupancy. Aggregate-only: no usernames, no review text, no extra photos beyond the cached hero.
“Lively recreational area with ball fields & courts, children's play areas & a community garden.” (Google editorial summary)
p99 citywide · p99 within Ravine / Naturalized Park
Source: Google Places API · match high (1.00 composite confidence) · last refreshed 5/9/2026. Privacy contract. Measures public attention, not occupancy.
Human activity signals: not available
No activity signals have landed for this park yet. The model has scored its physical form but it can’t yet say how often it’s programmed, photographed, or walked through. See /data-ethics for what we will and will not collect.
Does this score feel accurate?
Your read of Christie Pits Parkmatters. We’re testing whether the model lines up with how people actually use the park. Submissions are stored locally; no account needed.
Tell us how this park feels
We measure structure (canopy, edges, connectivity). You measure feeling. Both matter, and disagreement is itself useful civic data.
What would improve this park?
Generated from the weakest measured dimensions: a starting point, not a prescription.
- Activate the edges: encourage cafés, retail or community uses on the streets that face the park; replace blank or parking-lot edges where possible.
- Diversify what people can do in the park (playground, washroom, water, shade, performance, sport, garden): even small additions raise this score.
- Mitigate border vacuums (highways, rail, parking) with active programming on the still-permeable edges and treat the hostile edge as a design challenge.
Data sources
- City of Toronto Open Data: Parks (Green Space)Polygon boundaries, official names, types.
- Parks & Recreation FacilitiesInventory of in-park amenities (washrooms, fields, rinks…).
- Toronto Pedestrian NetworkSidewalk segments around and through parks; estimated park entrances.
- Toronto Centreline V2Street segments + intersection nodes near park edges; trails and walkways.
- Toronto 3D MassingBuilding footprints + heights for edge-building counts, frontage density, and tower-in-the-park risk.
- Toronto Treed AreaTree canopy share inside park polygons via stratified-grid sampling.
- Toronto Waterbodies & RiversWater surface inside parks + nearest-water distance for cooling.
- Ravine & Natural Feature ProtectionRavine overlap as a cooling / natural-comfort signal.
- Toronto Street Tree InventoryTree count + density inside park polygons.
- Neighbourhood Profiles(Pending) Equity context proxy.
- OpenStreetMap (Overpass API)Cafés, restaurants, retail, transit stops, parking, highways, rail.