Brookbanks Park
Ravine / Naturalized Park, middle of the pack overall (score 33, rank ~46th percentile). Strongest: connectivity; weakest: edge activation.
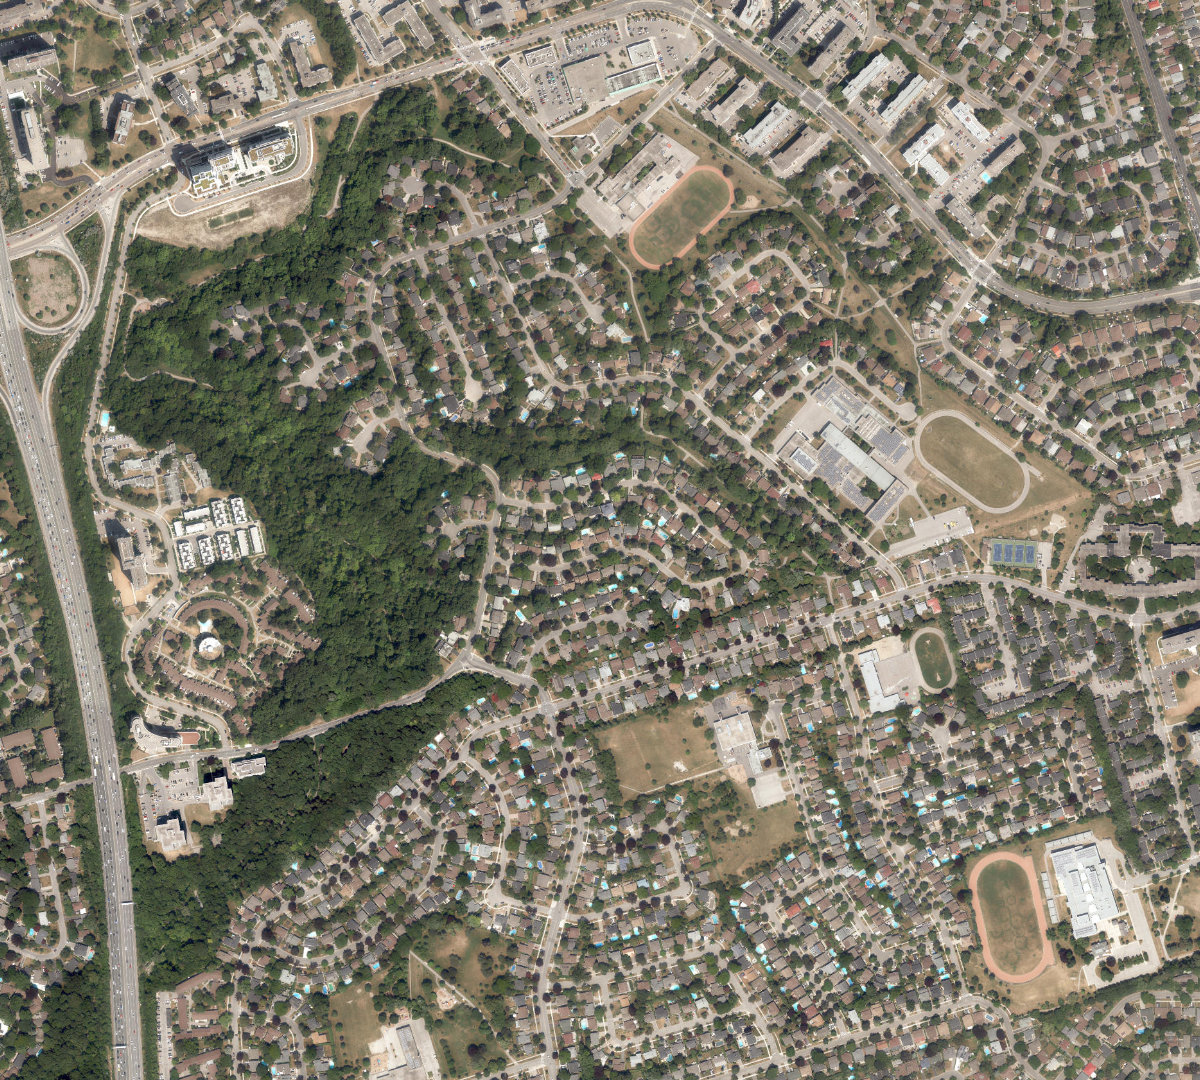
Aerial, City of Toronto orthophoto, ~8 cm/px source · cached 5/9/2026
Brookbanks Park scores 33.2 / 100. Strongest dimensions: connectivity and enclosure / eyes on park. Weakest: edge activation (0). Border-vacuum risk is elevated (100). This score is a transparent reading of Jane Jacobs-style vitality factors, not a definitive judgment.
Area · 26.66 ha
Weighted across six dimensions · confidence 72%
Scores are not bell-curved. Percentiles and expected scores provide context without changing the underlying model.
Loading map…
The parks map is loading.Explain this score
Where did the 33 come from? Each weighted contribution against a neutral 50 baseline. Green = pushed up; red = pulled down.
Sum of contributions = the headline score. A negative bar means that dimension dragged the park below the city-wide neutral baseline.
Why this park works
Brookbanks Park works because its connectivity score (83) is one of the city's strongest and its amenity diversity (12) is also above-average (47 transit stops sit within a 400 m walk; 70 intersections fall within 100 m of the edge).
What limits this park
Brookbanks Park is held back by edge activation (0, below-average): the surrounding streets carry too few active uses to spill into the park; border-vacuum risk is also elevated (100).
Most distinctive characteristic
Most distinctive feature: exceptionally high connectivity (83, top decile).
Jacobs reading
Brookbanks Park sits between an urban social park and an ecological retreat: moderately useful for both, exceptionally suited to neither.
Tradeoffs
- Connectivity (83) significantly outpaces natural comfort (53): well placed in the city but offers little shade or ecological respite.
- The park is enclosed by buildings (64) but the surrounding streets are quiet (edge activation 0): frame without animation.
- High connectivity coexists with high border-vacuum risk (100): much of that connectivity is to highways, rail, or parking lots, not to neighbourhoods.
Typology classification
Classified as Ravine / Naturalized Park: 77% ravine overlap, 6% canopy. Secondary read: Waterfront Park (nearest waterbody within ~0 m).
Edge Activation
Within 100 m of the park edge: 17 active uses (transit_stop, restaurant, retail) and 17 dead/hostile uses (highway, parking_lot). Active edges keep "eyes on the park" through the day; parking lots, blank institutional walls, rail and highway frontages drain street life.
Source: OSM POIs (amenity/shop) + Toronto Building Footprints + land use
Connectivity
Connectivity blends paths, intersections, transit, entrances, and edge density. This park has 67 mapped paths/walkways and 191 sidewalk segments within 50 m; 70 street intersections within 100 m; 47 transit stops within a 400 m walk; 54 estimated access points across ~10,173 m of perimeter. moderate edge density, small superblock penalty applied. Source coverage: centreline, pedestrian_network, transit_osm.
Source: Toronto Centreline V2 + Pedestrian Network + OSM transit stops
Amenity Diversity
1 distinct amenity types in the park (playground). Diversity, not raw count, drives the score so a park with many distinct activity types can outrank a larger park that repeats the same use.
Source: Toronto Parks & Recreation Facilities + OSM amenity tags
Natural Comfort
Natural-comfort components for this park: 5.7% estimated tree canopy; 76.5% inside the ravine system; 2.3% water surface; 136 city-mapped trees inside the polygon (5.1/ha). Reading: ravine-cooled. Source coverage: treed_area, ravine, waterbodies, street_trees. Impervious surface is approximated (Toronto's authoritative layer ships only as a raster GeoTIFF).
Source: Toronto Treed Area + Ravine + Waterbodies + Street Tree Inventory
Enclosure / Eyes on Park
533 buildings within 25 m of the park edge (49 mid-rise, 480 low-rise, 4 tower); avg edge height 6.6 m (~2 floors); 5.2 buildings per 100 m of 10,173 m perimeter (strong frontage density); edges are low-rise (mostly 2 to 3 floors); 4 towers ≥ 40 m within 25 m of the edge. "Eyes on the park" come strongest from the 49 mid-rise edge buildings.
Source: Toronto 3D Massing (building footprints + heights)
Border Vacuum Risk
Border-vacuum factors within 50 m of the park: Don Valley Parkway, parking_lot, parking_lot, parking_lot, parking_lot, parking_lot, parking_lot. Jacobs warned that highways, rail, parking lots and blank institutional edges act as "vacuums" that suppress foot traffic and isolate the park from its neighbourhood.
Source: Toronto Street Centreline (highways) + rail layer + OSM landuse + building footprints
Equity Context
Equity Context requires inputs not yet loaded for this park (Toronto Neighbourhood Profiles). Score is held at a neutral 50 with low confidence. Read with caution.
Source: Toronto Neighbourhood Profiles
Amenities (1 types · 1 records)
- playground
Nearby active-edge features (80)
- transit stop: Underhill Dr at Brookbanks Dr5 m
- parking lot15 m
- parking lot19 m
- transit stop: Underhill Dr at Brookbanks Dr25 m
- transit stop: Combermere Drive29 m
- transit stop: Brookbanks Dr at Valley Woods Road31 m
- transit stop: Combermere Drive35 m
- parking lot36 m
- restaurant: Pizza Pizza37 m
- parking lot41 m
- parking lot42 m
- highway: Don Valley Parkway44 m
- parking lot44 m
- transit stop: Valley Woods Road at Brookbanks Dr46 m
- highway: Don Valley Parkway54 m
- parking lot57 m
- transit stop: Brookbanks Dr at Valley Woods Road59 m
- restaurant: Chick-N-Joy61 m
- retail: Dollarama64 m
- parking lot64 m
- transit stop: Fenside Drive66 m
- transit stop67 m
- transit stop: Valley Woods Rd at York Mills Rd68 m
- restaurant: Subway69 m
- parking lot73 m
- transit stop: Opposite 44 Valley Woods Rd74 m
- parking lot83 m
- transit stop: 44 Valley Woods Rd84 m
- parking lot90 m
- transit stop: York Mills Rd at Sandover Dr94 m
- parking lot95 m
- parking lot95 m
- highway: Don Valley Parkway97 m
- parking lot98 m
- transit stop: Brookbanks Drive100 m
- parking lot101 m
- transit stop: Underhill Dr at Cassandra Blvd101 m
- parking lot102 m
- restaurant: A&W104 m
- transit stop: York Mills Rd at Valley Woods Road104 m
- parking lot105 m
- transit stop: Underhill Dr at Cassandra Blvd108 m
- transit stop: York Mills Rd at Sandover Dr108 m
- parking lot109 m
- transit stop: Fenside Drive109 m
- parking lot111 m
- parking lot112 m
- parking lot114 m
- cafe: Tim Hortons116 m
- highway: Don Valley Parkway117 m
- parking lot118 m
- transit stop: Gisburn Road123 m
- parking lot123 m
- parking lot126 m
- parking lot126 m
- transit stop: Brookbanks Drive127 m
- parking lot129 m
- transit stop: York Mills Road129 m
- parking lot131 m
- highway: Don Valley Parkway132 m
- parking lot142 m
- parking lot145 m
- parking lot145 m
- parking lot154 m
- highway: Don Valley Parkway157 m
- parking lot157 m
- parking lot160 m
- parking lot165 m
- highway: Don Valley Parkway166 m
- parking lot171 m
- parking lot172 m
- highway: Don Valley Parkway173 m
- highway: Don Valley Parkway178 m
- parking lot179 m
- transit stop: 29 Valley Woods Rd179 m
- transit stop: Ness Drive186 m
- parking lot187 m
- parking lot188 m
- transit stop: Lynedock Cres at Fernside Dr189 m
- highway: Don Valley Parkway191 m
Park profile
Five-axis radar across the structural dimensions.
Citywide percentile ranks
Across all Toronto parks in the dataset.
- Overall vitality46th
- Edge activation27th
- Connectivity99th
- Amenity diversity72th
- Natural comfort65th
- Enclosure55th
Most similar parks
Closest in metric space across the five structural dimensions.
- Clarence Square ParkCivic Square42
- Alex Marchetti ParkWaterfront Park37
- Bridletowne ParkNeighbourhood Park41
- Taylor Creek ParkWaterfront Park35
- Wincott ParkWaterfront Park40
Most opposite parks
Furthest in metric space. Useful for recognising what kind of park this isn’t.
- Joseph Burr Tyrrell ParkUrban Plaza50
- Simcoe ParkTower-Community Green Space51
- Queen'S Quay Traffic IslandWaterfront Park49
- Manor Community GreenUrban Plaza57
- Bernard Avenue Road AllowanceUrban Plaza54
Human activity signals: not available
No activity signals have landed for this park yet. The model has scored its physical form but it can’t yet say how often it’s programmed, photographed, or walked through. See /data-ethics for what we will and will not collect.
Does this score feel accurate?
Your read of Brookbanks Parkmatters. We’re testing whether the model lines up with how people actually use the park. Submissions are stored locally; no account needed.
Tell us how this park feels
We measure structure (canopy, edges, connectivity). You measure feeling. Both matter, and disagreement is itself useful civic data.
What would improve this park?
Generated from the weakest measured dimensions: a starting point, not a prescription.
- Activate the edges: encourage cafés, retail or community uses on the streets that face the park; replace blank or parking-lot edges where possible.
- Diversify what people can do in the park (playground, washroom, water, shade, performance, sport, garden): even small additions raise this score.
- Mitigate border vacuums (highways, rail, parking) with active programming on the still-permeable edges and treat the hostile edge as a design challenge.
Data sources
- City of Toronto Open Data: Parks (Green Space)Polygon boundaries, official names, types.
- Parks & Recreation FacilitiesInventory of in-park amenities (washrooms, fields, rinks…).
- Toronto Pedestrian NetworkSidewalk segments around and through parks; estimated park entrances.
- Toronto Centreline V2Street segments + intersection nodes near park edges; trails and walkways.
- Toronto 3D MassingBuilding footprints + heights for edge-building counts, frontage density, and tower-in-the-park risk.
- Toronto Treed AreaTree canopy share inside park polygons via stratified-grid sampling.
- Toronto Waterbodies & RiversWater surface inside parks + nearest-water distance for cooling.
- Ravine & Natural Feature ProtectionRavine overlap as a cooling / natural-comfort signal.
- Toronto Street Tree InventoryTree count + density inside park polygons.
- Neighbourhood Profiles(Pending) Equity context proxy.
- OpenStreetMap (Overpass API)Cafés, restaurants, retail, transit stops, parking, highways, rail.