Albert Standing Park
Urban Plaza, middle of the pack overall (score 36, rank ~58th percentile). Strongest: connectivity; weakest: edge activation.
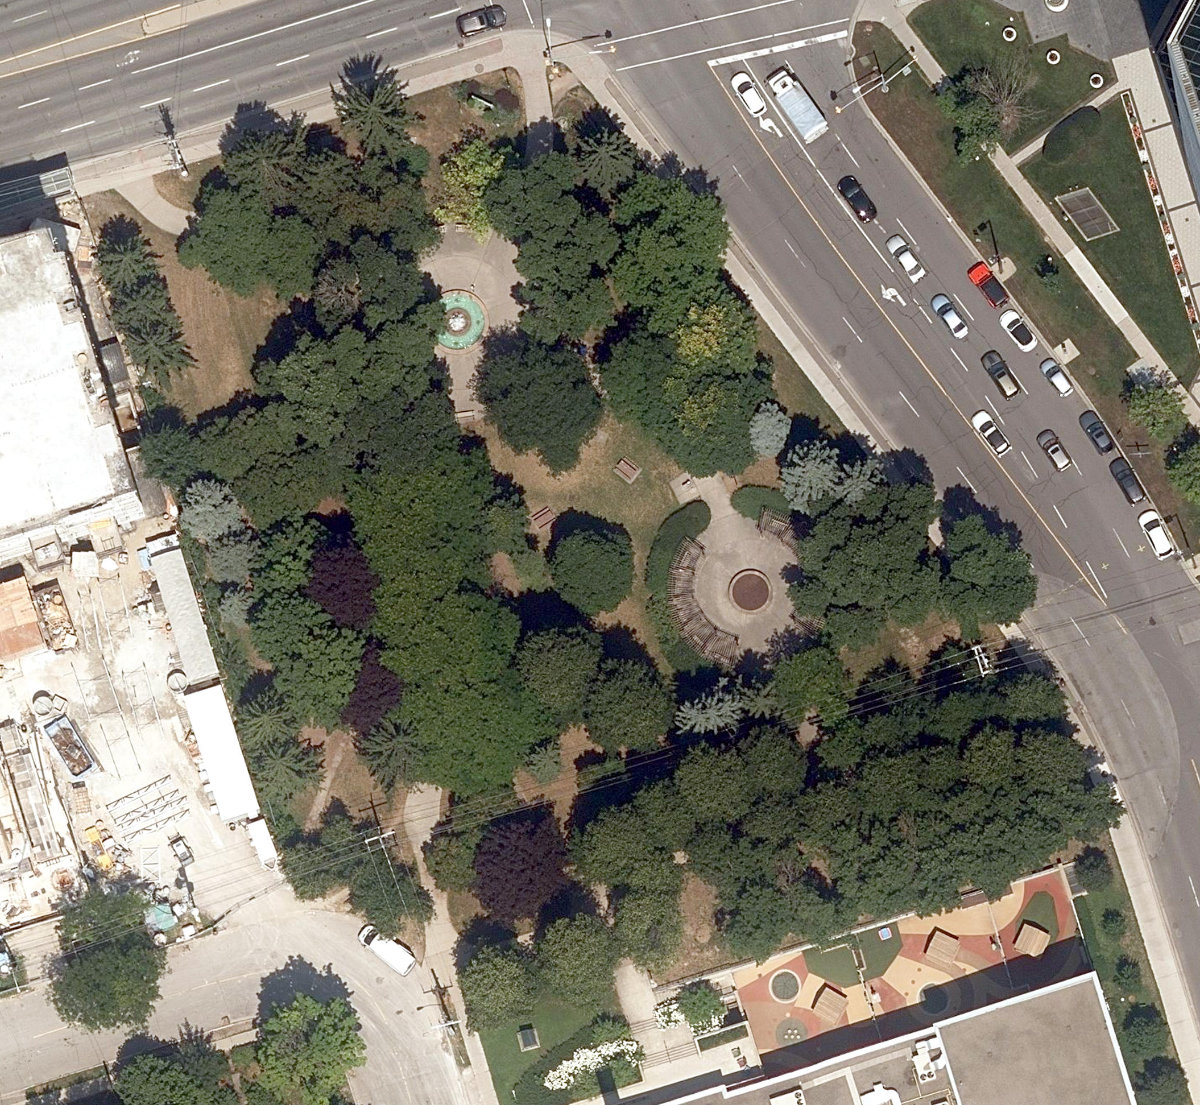
Aerial, City of Toronto orthophoto, ~8 cm/px source · cached 5/9/2026
Albert Standing Park scores 35.8 / 100. Strongest dimensions: enclosure / eyes on park and connectivity. Weakest: edge activation (0). Border-vacuum risk is elevated (66). This score is a transparent reading of Jane Jacobs-style vitality factors, not a definitive judgment.
Area · 0.49 ha
Weighted across six dimensions · confidence 68%
Scores are not bell-curved. Percentiles and expected scores provide context without changing the underlying model.
Loading map…
The parks map is loading.Explain this score
Where did the 36 come from? Each weighted contribution against a neutral 50 baseline. Green = pushed up; red = pulled down.
Sum of contributions = the headline score. A negative bar means that dimension dragged the park below the city-wide neutral baseline.
Why this park works
Albert Standing Park works because its connectivity score (78) is one of the city's strongest and its enclosure (78) is also top quartile (31 transit stops sit within a 400 m walk).
What limits this park
Albert Standing Park is held back by edge activation (0, below-average): the surrounding streets carry too few active uses to spill into the park; border-vacuum risk is also elevated (66).
Most distinctive characteristic
Most distinctive feature: exceptionally high connectivity (78, top decile).
Jacobs reading
Albert Standing Park sits between an urban social park and an ecological retreat: moderately useful for both, exceptionally suited to neither.
Tradeoffs
- Connectivity (78) significantly outpaces natural comfort (44): well placed in the city but offers little shade or ecological respite.
- The park is enclosed by buildings (78) but the surrounding streets are quiet (edge activation 0): frame without animation.
- 12 nearby towers cast wind and shadow without contributing canopy: passive surveillance is plentiful but human-scale comfort is not.
- High connectivity coexists with high border-vacuum risk (66): much of that connectivity is to highways, rail, or parking lots, not to neighbourhoods.
Typology classification
Classified as Urban Plaza: 4923 m², paved (0% canopy), 19.0 buildings/100 m
Edge Activation
Within 100 m of the park edge: 9 active uses (retail, transit_stop, cafe) and 9 dead/hostile uses (parking_lot, rail). Active edges keep "eyes on the park" through the day; parking lots, blank institutional walls, rail and highway frontages drain street life.
Source: OSM POIs (amenity/shop) + Toronto Building Footprints + land use
Connectivity
Connectivity blends paths, intersections, transit, entrances, and edge density. This park has 18 mapped paths/walkways and 27 sidewalk segments within 50 m; 8 street intersections within 100 m; 31 transit stops within a 400 m walk; 10 estimated access points across ~289 m of perimeter. edge density is healthy, no superblock penalty. Source coverage: centreline, pedestrian_network, transit_osm.
Source: Toronto Centreline V2 + Pedestrian Network + OSM transit stops
Amenity Diversity
1 distinct amenity types in the park (picnic). Diversity, not raw count, drives the score so a park with many distinct activity types can outrank a larger park that repeats the same use.
Source: Toronto Parks & Recreation Facilities + OSM amenity tags
Natural Comfort
Natural-comfort components for this park: ~10.5% effective canopy (0.0% from contiguous tree polygons + scattered tree density); nearest waterbody ~892 m; 15 city-mapped trees inside the polygon (15.0/ha). Reading: exposed. Source coverage: waterbodies, street_trees. Impervious surface is approximated (Toronto's authoritative layer ships only as a raster GeoTIFF).
Source: Toronto Treed Area + Ravine + Waterbodies + Street Tree Inventory
Enclosure / Eyes on Park
55 buildings within 25 m of the park edge (8 mid-rise, 35 low-rise, 12 tower); avg edge height 26.3 m (~9 floors); 19.0 buildings per 100 m of 289 m perimeter (strong frontage density); edges lean tall but still framed; 12 towers ≥ 40 m within 25 m of the edge. "Eyes on the park" come strongest from the 8 mid-rise edge buildings.
Source: Toronto 3D Massing (building footprints + heights)
Border Vacuum Risk
Border-vacuum factors within 50 m of the park: parking_lot, Line 4 Sheppard tail track, Line 4 Sheppard access track, Line 4 Sheppard tail track. Jacobs warned that highways, rail, parking lots and blank institutional edges act as "vacuums" that suppress foot traffic and isolate the park from its neighbourhood.
Source: Toronto Street Centreline (highways) + rail layer + OSM landuse + building footprints
Equity Context
Equity Context requires inputs not yet loaded for this park (Toronto Neighbourhood Profiles). Score is held at a neutral 50 with low confidence. Read with caution.
Source: Toronto Neighbourhood Profiles
Amenities (1 types · 1 records)
- picnic
Nearby active-edge features (76)
- parking lot5 m
- rail: Line 4 Sheppard access track17 m
- transit stop: Sheppard Ave W at Beecroft Rd29 m
- rail: Line 4 Sheppard tail track36 m
- rail: Line 4 Sheppard tail track41 m
- retail: TrendyMED52 m
- transit stop: Beecroft Entrance56 m
- parking lot58 m
- cafe: Java Joe’s59 m
- parking lot62 m
- retail: Bespoke Optical63 m
- rail75 m
- parking lot76 m
- retail: laser engraving Toronto78 m
- retail: KiaJewelry86 m
- transit stop: Sheppard Avenue West Entrance88 m
- transit stop: Sheppard-Yonge Station91 m
- parking lot: TTC Vehicle Parking96 m
- retail: Food Basics100 m
- transit stop: Sheppard-Yonge Station107 m
- parking lot119 m
- transit stop: Yonge / Poyntz Entrance124 m
- cafe: Tim Hortons125 m
- retail: Vape Loft128 m
- retail: The Maze Hair Salon128 m
- transit stop: Sheppard-Yonge Station129 m
- retail: LCBO129 m
- restaurant: Golden Rice Noodle130 m
- cafe: Presotea131 m
- transit stop: Sheppard-Yonge Station135 m
- transit stop: Yonge St. @ Poyntz Ave.143 m
- transit stop: Sheppard-Yonge Station145 m
- restaurant: Taco Bell150 m
- parking lot150 m
- parking lot155 m
- highway: Yonge Street155 m
- highway: Yonge Street160 m
- highway: Yonge Street164 m
- highway: Yonge Street164 m
- parking lot165 m
- transit stop: Harlandale Av Entrance167 m
- retail167 m
- parking lot167 m
- cafe: Anotherland Coffee167 m
- retail: myPet Shop on Yonge169 m
- parking lot169 m
- transit stop: Sheppard-Yonge170 m
- highway: Yonge Street171 m
- retail: Dahlia Wellness Centre172 m
- restaurant: Super Chicken172 m
- restaurant: Burrito Boyz176 m
- transit stop: Sheppard-Yonge178 m
- highway: Yonge Street178 m
- restaurant: McDonald's179 m
- retail: Johnston Smoke & Variety180 m
- transit stop: Sheppard-Yonge180 m
- transit stop: Yonge / Anndale Entramce180 m
- parking lot180 m
- parking lot181 m
- transit stop: Sheppard-Yonge183 m
- restaurant: EAT BKK Thai Kitchen183 m
- restaurant: Hero Certified Burgers185 m
- rail185 m
- rail186 m
- parking lot186 m
- highway: Yonge Street188 m
- parking lot189 m
- highway: Yonge Street190 m
- transit stop: Sheppard-Yonge190 m
- highway: Yonge Street192 m
- parking lot192 m
- transit stop: Yonge Street at Sheppard Avenue West194 m
- parking lot195 m
- transit stop: 4711 Yonge Street Entrance195 m
- parking lot199 m
- highway: Yonge Street200 m
Park profile
Five-axis radar across the structural dimensions.
Citywide percentile ranks
Across all Toronto parks in the dataset.
- Overall vitality58th
- Edge activation26th
- Connectivity97th
- Amenity diversity72th
- Natural comfort47th
- Enclosure81th
Most similar parks
Closest in metric space across the five structural dimensions.
- Ferrand Drive ParkParkette44
- Warden Hilltop Community CentreParkette44
- Wadsworth ParkNeighbourhood Park44
- Lamport Stadium ParkNeighbourhood Park37
- York Mills Valley ParkRavine / Naturalized Park33
Most opposite parks
Furthest in metric space. Useful for recognising what kind of park this isn’t.
- Trca Lands ( 26)Ravine / Naturalized Park27
- Toronto Islands - Muggs Island ParkRavine / Naturalized Park25
- Rouge ParkRavine / Naturalized Park26
- Rouge ParkRavine / Naturalized Park28
- Rouge ParkWaterfront Park25
Human activity signals: not available
No activity signals have landed for this park yet. The model has scored its physical form but it can’t yet say how often it’s programmed, photographed, or walked through. See /data-ethics for what we will and will not collect.
Does this score feel accurate?
Your read of Albert Standing Parkmatters. We’re testing whether the model lines up with how people actually use the park. Submissions are stored locally; no account needed.
Tell us how this park feels
We measure structure (canopy, edges, connectivity). You measure feeling. Both matter, and disagreement is itself useful civic data.
What would improve this park?
Generated from the weakest measured dimensions: a starting point, not a prescription.
- Activate the edges: encourage cafés, retail or community uses on the streets that face the park; replace blank or parking-lot edges where possible.
- Diversify what people can do in the park (playground, washroom, water, shade, performance, sport, garden): even small additions raise this score.
- Increase canopy and reduce paved area. Shade and water features extend usable hours and seasons.
- Mitigate border vacuums (highways, rail, parking) with active programming on the still-permeable edges and treat the hostile edge as a design challenge.
Data sources
- City of Toronto Open Data: Parks (Green Space)Polygon boundaries, official names, types.
- Parks & Recreation FacilitiesInventory of in-park amenities (washrooms, fields, rinks…).
- Toronto Pedestrian NetworkSidewalk segments around and through parks; estimated park entrances.
- Toronto Centreline V2Street segments + intersection nodes near park edges; trails and walkways.
- Toronto 3D MassingBuilding footprints + heights for edge-building counts, frontage density, and tower-in-the-park risk.
- Toronto Treed AreaTree canopy share inside park polygons via stratified-grid sampling.
- Toronto Waterbodies & RiversWater surface inside parks + nearest-water distance for cooling.
- Ravine & Natural Feature ProtectionRavine overlap as a cooling / natural-comfort signal.
- Toronto Street Tree InventoryTree count + density inside park polygons.
- Neighbourhood Profiles(Pending) Equity context proxy.
- OpenStreetMap (Overpass API)Cafés, restaurants, retail, transit stops, parking, highways, rail.