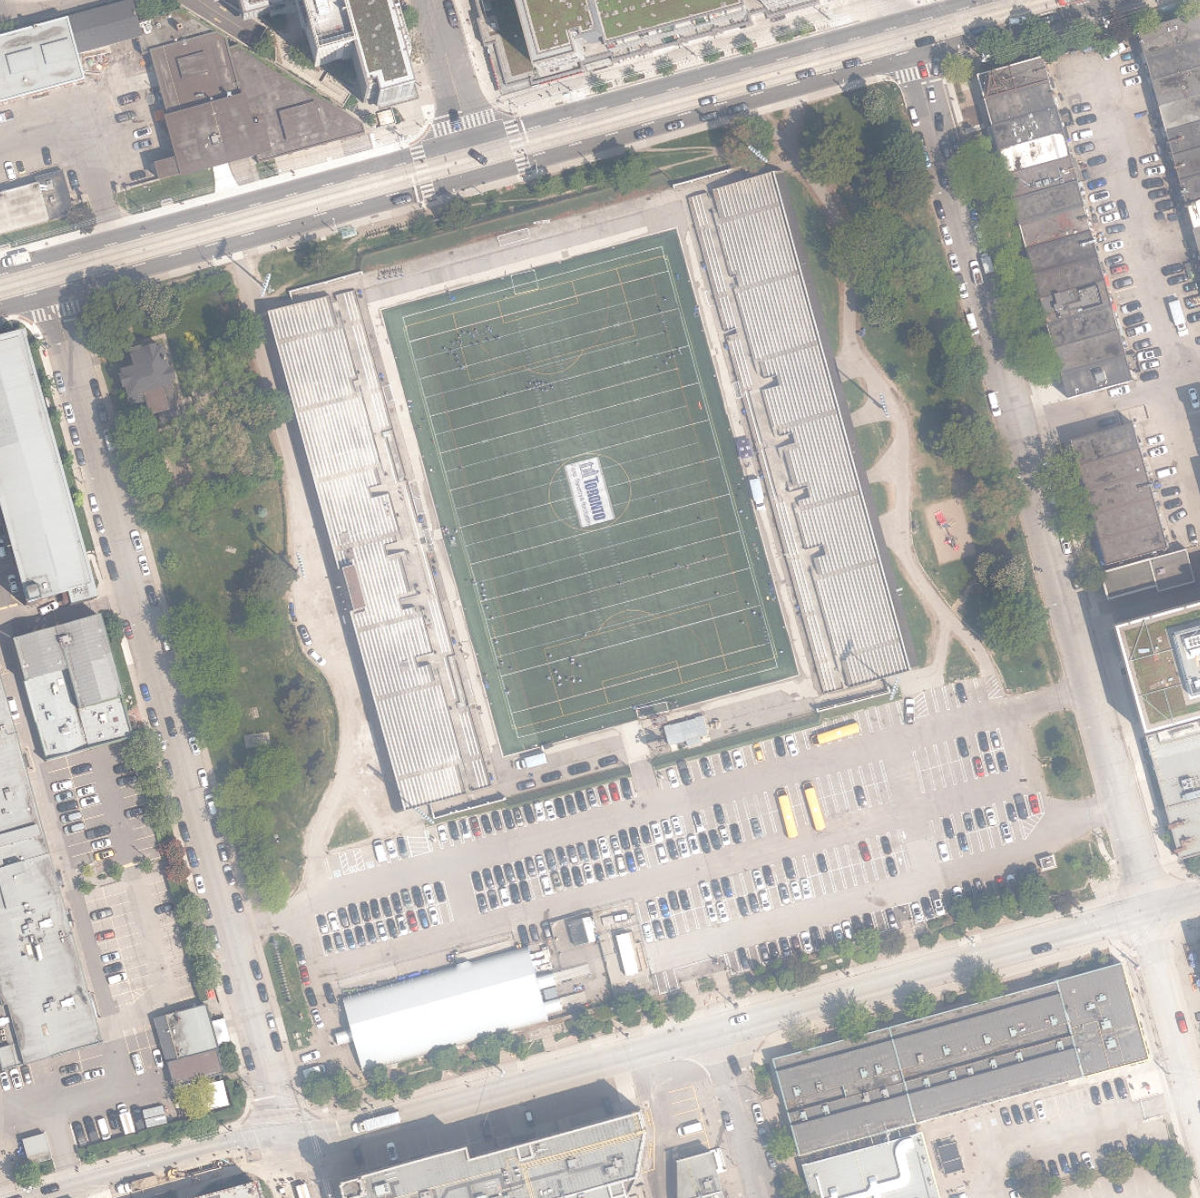
Lamport Stadium Park
Neighbourhood Park, middle of the pack overall (score 37, rank ~63th percentile). Strongest: connectivity; weakest: edge activation.
Aerial, City of Toronto orthophoto, ~8 cm/px source · cached 5/9/2026
Lamport Stadium Park scores 36.8 / 100. Strongest dimensions: enclosure / eyes on park and connectivity. Weakest: edge activation (0). Border-vacuum risk is elevated (84). This score is a transparent reading of Jane Jacobs-style vitality factors, not a definitive judgment.
Area · 3.73 ha
Weighted across six dimensions · confidence 68%
Scores are not bell-curved. Percentiles and expected scores provide context without changing the underlying model.
Loading map…
The parks map is loading.Explain this score
Where did the 37 come from? Each weighted contribution against a neutral 50 baseline. Green = pushed up; red = pulled down.
Sum of contributions = the headline score. A negative bar means that dimension dragged the park below the city-wide neutral baseline.
Why this park works
Lamport Stadium Park works because its connectivity score (77) is one of the city's strongest and its amenity diversity (21) is also top decile (31 transit stops sit within a 400 m walk; 20 intersections fall within 100 m of the edge).
What limits this park
Lamport Stadium Park's edges are fronted by border-vacuum land uses (highways, rail, parking, blank institutional), risk score 84.
Most distinctive characteristic
Most distinctive feature: exceptionally high connectivity (77, top decile).
Jacobs reading
Lamport Stadium Park sits between an urban social park and an ecological retreat: moderately useful for both, exceptionally suited to neither.
Tradeoffs
- Connectivity (77) significantly outpaces natural comfort (51): well placed in the city but offers little shade or ecological respite.
- The park is enclosed by buildings (80) but the surrounding streets are quiet (edge activation 0): frame without animation.
- High connectivity coexists with high border-vacuum risk (84): much of that connectivity is to highways, rail, or parking lots, not to neighbourhoods.
Typology classification
Classified as Neighbourhood Park: 3.7 ha, framed by 18 mid-rise vs 5 towers
Edge Activation
Within 100 m of the park edge: 21 active uses (restaurant, cafe, retail, transit_stop) and 12 dead/hostile uses (parking_lot). Active edges keep "eyes on the park" through the day; parking lots, blank institutional walls, rail and highway frontages drain street life.
Source: OSM POIs (amenity/shop) + Toronto Building Footprints + land use
Connectivity
Connectivity blends paths, intersections, transit, entrances, and edge density. This park has 11 mapped paths/walkways and 33 sidewalk segments within 50 m; 20 street intersections within 100 m; 31 transit stops within a 400 m walk; 6 estimated access points across ~773 m of perimeter. edge density is healthy, no superblock penalty. Source coverage: centreline, pedestrian_network, transit_osm.
Source: Toronto Centreline V2 + Pedestrian Network + OSM transit stops
Amenity Diversity
2 distinct amenity types in the park (playground, tennis). Diversity, not raw count, drives the score so a park with many distinct activity types can outrank a larger park that repeats the same use.
Source: Toronto Parks & Recreation Facilities + OSM amenity tags
Natural Comfort
Natural-comfort components for this park: ~19.5% effective canopy (0.0% from contiguous tree polygons + scattered tree density); nearest waterbody ~983 m; 104 city-mapped trees inside the polygon (27.9/ha). Reading: exposed. Source coverage: waterbodies, street_trees. Impervious surface is approximated (Toronto's authoritative layer ships only as a raster GeoTIFF).
Source: Toronto Treed Area + Ravine + Waterbodies + Street Tree Inventory
Enclosure / Eyes on Park
37 buildings within 25 m of the park edge (18 mid-rise, 14 low-rise, 5 tower); avg edge height 17.0 m (~6 floors); 4.8 buildings per 100 m of 773 m perimeter (strong frontage density); edges are at a Jacobs-scale walkable mid-rise (3 to 7 floors); 5 towers ≥ 40 m within 25 m of the edge. "Eyes on the park" come strongest from the 18 mid-rise edge buildings.
Source: Toronto 3D Massing (building footprints + heights)
Border Vacuum Risk
Border-vacuum factors within 50 m of the park: parking_lot, parking_lot, parking_lot, parking_lot, parking_lot, parking_lot, parking_lot. Jacobs warned that highways, rail, parking lots and blank institutional edges act as "vacuums" that suppress foot traffic and isolate the park from its neighbourhood.
Source: Toronto Street Centreline (highways) + rail layer + OSM landuse + building footprints
Equity Context
Equity Context requires inputs not yet loaded for this park (Toronto Neighbourhood Profiles). Score is held at a neutral 50 with low confidence. Read with caution.
Source: Toronto Neighbourhood Profiles
Amenities (2 types · 2 records)
- playground
- tennis
Nearby active-edge features (74)
- parking lot0 m
- transit stop: Joe Shuster Way11 m
- transit stop: Joe Shuster Way14 m
- parking lot16 m
- transit stop: Jefferson Avenue21 m
- restaurant: School25 m
- retail: PetSmart32 m
- retail: Winners33 m
- retail: Longo's34 m
- cafe: Starbucks34 m
- retail: Structube35 m
- retail: Toronto Camera Service Centre36 m
- retail: Canadian Tire36 m
- cafe: Breadflour41 m
- parking lot41 m
- restaurant: Liberty Village Market & Café43 m
- parking lot46 m
- parking lot47 m
- parking lot48 m
- parking lot49 m
- parking lot52 m
- restaurant: McDonald's57 m
- restaurant: Kinton Ramen63 m
- restaurant: Caffino64 m
- retail: Fuzion Convenience66 m
- parking lot66 m
- cafe: Louie Coffee74 m
- transit stop: Atlantic Avenue75 m
- cafe: Arvo76 m
- parking lot85 m
- parking lot96 m
- retail: Gioia Beauty and Spa96 m
- parking lot98 m
- retail: L Studio Salon Spa101 m
- transit stop: King Street West102 m
- restaurant: Impact109 m
- restaurant: The Craft Brasserie & Bar114 m
- transit stop: Atlantic Avenue116 m
- rail: Weston Subdivision116 m
- parking lot124 m
- parking lot127 m
- transit stop129 m
- retail: Ren’s Pets130 m
- parking lot132 m
- rail: Weston Subdivision141 m
- parking lot144 m
- restaurant: The Lounge145 m
- parking lot148 m
- parking lot154 m
- restaurant: Left Field Brewery158 m
- parking lot163 m
- retail: west elm163 m
- restaurant: Chipotle165 m
- restaurant: Barcelona Tavern165 m
- retail: No Frills165 m
- parking lot166 m
- parking lot168 m
- parking lot169 m
- parking lot170 m
- parking lot: SP+173 m
- parking lot180 m
- retail: The Makeover Place Inc.180 m
- retail: Dollarama181 m
- retail: Convenience Canada186 m
- parking lot186 m
- parking lot187 m
- cafe: Balzac's Coffee190 m
- restaurant: Mildred’s Temple Kitchen191 m
- restaurant: Levetto191 m
- parking lot193 m
- restaurant: Subway193 m
- retail195 m
- parking lot199 m
- retail: LCBO199 m
Park profile
Five-axis radar across the structural dimensions.
Citywide percentile ranks
Across all Toronto parks in the dataset.
- Overall vitality63th
- Edge activation48th
- Connectivity97th
- Amenity diversity90th
- Natural comfort62th
- Enclosure84th
Most similar parks
Closest in metric space across the five structural dimensions.
- Wadsworth ParkNeighbourhood Park44
- York Mills Valley ParkRavine / Naturalized Park33
- Sanwood ParkNeighbourhood Park45
- Warden Hilltop Community CentreParkette44
- East Mall ParkNeighbourhood Park42
Most opposite parks
Furthest in metric space. Useful for recognising what kind of park this isn’t.
- Toronto Islands - Muggs Island ParkRavine / Naturalized Park25
- Trca Lands ( 26)Ravine / Naturalized Park27
- Rouge ParkRavine / Naturalized Park21
- Simcoe ParkTower-Community Green Space51
- Rouge ParkWaterfront Park25
Human activity signals: not available
No activity signals have landed for this park yet. The model has scored its physical form but it can’t yet say how often it’s programmed, photographed, or walked through. See /data-ethics for what we will and will not collect.
Does this score feel accurate?
Your read of Lamport Stadium Parkmatters. We’re testing whether the model lines up with how people actually use the park. Submissions are stored locally; no account needed.
Tell us how this park feels
We measure structure (canopy, edges, connectivity). You measure feeling. Both matter, and disagreement is itself useful civic data.
What would improve this park?
Generated from the weakest measured dimensions: a starting point, not a prescription.
- Activate the edges: encourage cafés, retail or community uses on the streets that face the park; replace blank or parking-lot edges where possible.
- Diversify what people can do in the park (playground, washroom, water, shade, performance, sport, garden): even small additions raise this score.
- Mitigate border vacuums (highways, rail, parking) with active programming on the still-permeable edges and treat the hostile edge as a design challenge.
Data sources
- City of Toronto Open Data: Parks (Green Space)Polygon boundaries, official names, types.
- Parks & Recreation FacilitiesInventory of in-park amenities (washrooms, fields, rinks…).
- Toronto Pedestrian NetworkSidewalk segments around and through parks; estimated park entrances.
- Toronto Centreline V2Street segments + intersection nodes near park edges; trails and walkways.
- Toronto 3D MassingBuilding footprints + heights for edge-building counts, frontage density, and tower-in-the-park risk.
- Toronto Treed AreaTree canopy share inside park polygons via stratified-grid sampling.
- Toronto Waterbodies & RiversWater surface inside parks + nearest-water distance for cooling.
- Ravine & Natural Feature ProtectionRavine overlap as a cooling / natural-comfort signal.
- Toronto Street Tree InventoryTree count + density inside park polygons.
- Neighbourhood Profiles(Pending) Equity context proxy.
- OpenStreetMap (Overpass API)Cafés, restaurants, retail, transit stops, parking, highways, rail.