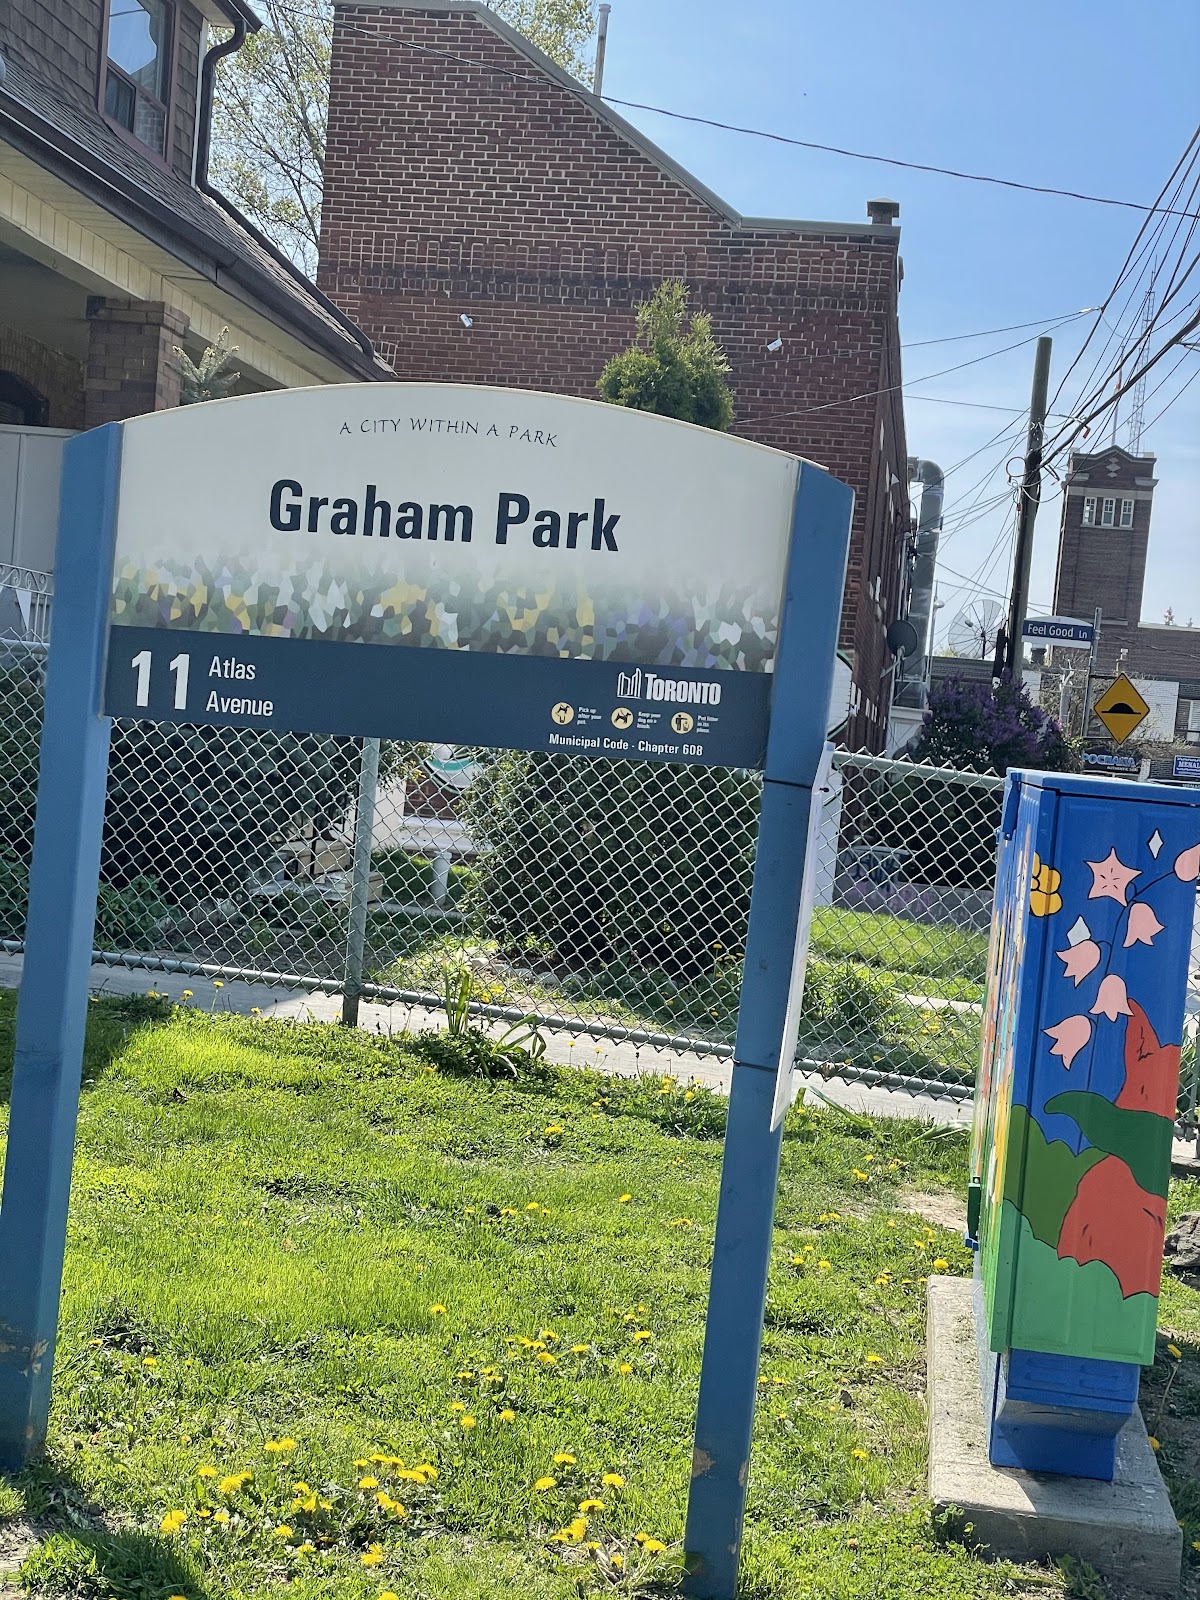
Graham Park
Urban Plaza, one of the city's strongest overall (score 54, rank ~98th percentile). Strongest: edge activation; weakest: natural comfort.
Photo by Dimitrios Nikolaou via Google Places · cached 5/9/2026
Graham Park scores 53.7 / 100. Strongest dimensions: enclosure / eyes on park and edge activation. Weakest: amenity diversity (0). Border-vacuum risk is low. This score is a transparent reading of Jane Jacobs-style vitality factors, not a definitive judgment.
Area · 0.05 ha
Weighted across six dimensions · confidence 56%
Scores are not bell-curved. Percentiles and expected scores provide context without changing the underlying model.
Loading map…
The parks map is loading.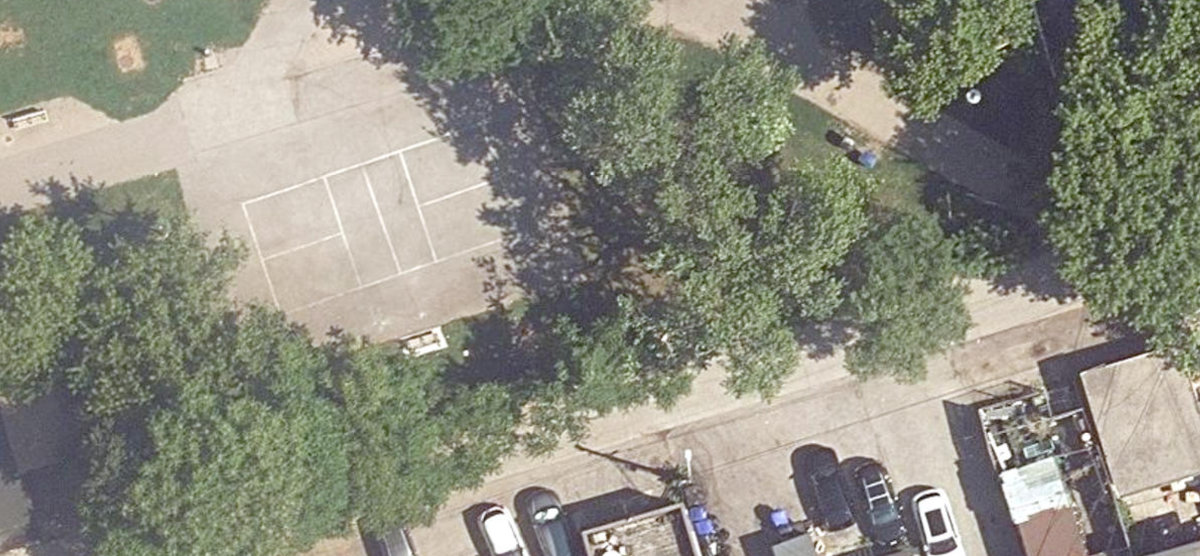
Explain this score
Where did the 54 come from? Each weighted contribution against a neutral 50 baseline. Green = pushed up; red = pulled down.
Sum of contributions = the headline score. A negative bar means that dimension dragged the park below the city-wide neutral baseline.
Why this park works
Graham Park works because its edge activation score (78) is one of the city's strongest and its enclosure (83) is also top quartile (its perimeter is lined with active uses).
What limits this park
Graham Park is held back by natural comfort (24, bottom quartile): only 0% canopy means little summer shade.
Most distinctive characteristic
Most distinctive feature: exceptionally high edge activation (78, top decile).
Jacobs reading
Graham Park is a dense urban social park. Jacobs would recognise it: lots of eyes, lots of streets, lots of edge life; not where you go to escape.
Tradeoffs
- Connectivity (62) significantly outpaces natural comfort (24): well placed in the city but offers little shade or ecological respite.
Performance in context
- This park is a strong overperformer for its cohort: raw 54 versus an expected 36 for similar parks (pocket Urban Plaza) (gap +17).
Typology classification
Classified as Urban Plaza: 547 m², paved (0% canopy), 68.1 buildings/100 m
Edge Activation
Within 100 m of the park edge: 37 active uses (restaurant, retail, cafe, transit_stop) and 1 dead/hostile uses (parking_lot). Active edges keep "eyes on the park" through the day; parking lots, blank institutional walls, rail and highway frontages drain street life.
Source: OSM POIs (amenity/shop) + Toronto Building Footprints + land use
Connectivity
Connectivity blends paths, intersections, transit, entrances, and edge density. This park has 4 mapped paths/walkways and 7 sidewalk segments within 50 m; 11 street intersections within 100 m; 9 transit stops within a 400 m walk; 2 estimated access points across ~126 m of perimeter. edge density is healthy, no superblock penalty. Source coverage: centreline, pedestrian_network, transit_osm.
Source: Toronto Centreline V2 + Pedestrian Network + OSM transit stops
Amenity Diversity
No amenities recorded. Score is 0 until inventory is loaded.
Source: Toronto Parks & Recreation Facilities + OSM amenity tags
Natural Comfort
Natural-comfort components for this park: 0.0% estimated tree canopy; nearest waterbody ~930 m. Reading: exposed. Source coverage: waterbodies. Impervious surface is approximated (Toronto's authoritative layer ships only as a raster GeoTIFF).
Source: Toronto Treed Area + Ravine + Waterbodies + Street Tree Inventory
Enclosure / Eyes on Park
86 buildings within 25 m of the park edge (5 mid-rise, 81 low-rise, 0 tower); avg edge height 6.8 m (~2 floors); 68.1 buildings per 100 m of 126 m perimeter (strong frontage density); edges are low-rise (mostly 2 to 3 floors); no towers immediately adjacent. "Eyes on the park" come strongest from the 5 mid-rise edge buildings.
Source: Toronto 3D Massing (building footprints + heights)
Border Vacuum Risk
Park edges face the city. No significant border vacuum detected.
Source: Toronto Street Centreline (highways) + rail layer + OSM landuse + building footprints
Equity Context
Equity Context requires inputs not yet loaded for this park (Toronto Neighbourhood Profiles). Score is held at a neutral 50 with low confidence. Read with caution.
Source: Toronto Neighbourhood Profiles
Amenities (0)
No amenities recorded for this park.
Nearby active-edge features (68)
- restaurant: Nodo37 m
- retail: St. Clair Fruit Market37 m
- retail38 m
- retail: Rome Travel Agency38 m
- retail: Delta Dawn Floral38 m
- retail: Marcelleria Atlas38 m
- retail: Modern Edge Salon38 m
- retail: Roast Fine Foods38 m
- restaurant: Emma's Country Kitchen39 m
- retail: Suotu E-Scooter & E-Bike41 m
- restaurant: The Gym42 m
- retail46 m
- restaurant: Tapworks Pub46 m
- restaurant: Pukka49 m
- restaurant: Hungry Jack's Italian Mediterranean Grill51 m
- transit stop: Arlington Avenue54 m
- retail: Arlington Super Variety55 m
- retail59 m
- cafe: De Mello Coffee x Chocolat de Kat72 m
- restaurant: Zini Pizza76 m
- retail76 m
- cafe: Krave Coffee77 m
- retail: Optical77 m
- restaurant: Aviv Immigrant Kitchen79 m
- restaurant: FK80 m
- restaurant: Mi Tierra80 m
- retail: Planet Jewellery84 m
- retail: The Spirit of St. Clair86 m
- parking lot87 m
- cafe: Zaza Expresso Bar87 m
- restaurant: Black Tulip Restaurant88 m
- retail88 m
- restaurant: Chai Pochana91 m
- retail: Menalon Bakery93 m
- retail: Ecoexistance93 m
- restaurant: Sushi Kozoku96 m
- retail: Skinprovement Medi Spa & Laser Clinic98 m
- restaurant: Savera99 m
- retail: Gypsy100 m
- retail101 m
- restaurant: Wings N Dip102 m
- retail105 m
- restaurant: Ferro109 m
- restaurant: Dragon Delight Chinese Cuisine109 m
- restaurant: Riz110 m
- transit stop: Arlington Avenue116 m
- retail: Acapella125 m
- restaurant: Nama Sushi130 m
- restaurant: What A Bagel135 m
- retail: St. Clair Delicatessen136 m
- retail: Mabel's Bakery142 m
- retail: Poppyseed Creative Living144 m
- retail: Nino’s Hairstyling144 m
- restaurant: Romi's148 m
- parking lot161 m
- transit stop: Winona163 m
- parking lot167 m
- parking lot168 m
- retail: The Pretty Rugged169 m
- retail: Spectacular Sounds171 m
- restaurant: The Rushton174 m
- parking lot179 m
- retail: Pain Perdu186 m
- retail: Winona Hearing Aid Centre190 m
- parking lot192 m
- retail197 m
- transit stop: Winona Drive198 m
- retail198 m
Park profile
Five-axis radar across the structural dimensions.
Citywide percentile ranks
Across all Toronto parks in the dataset.
- Overall vitality98th
- Edge activation100th
- Connectivity77th
- Amenity diversity7th
- Natural comfort3th
- Enclosure88th
Most similar parks
Closest in metric space across the five structural dimensions.
- St. Mary Street ParketteUrban Plaza51
- Pape Avenue CemeteryUrban Plaza50
- Earlscourt ParkUrban Plaza51
- OLD CITY HALL - Building GroundsCivic Square53
- Toronto Sculpture GardenUrban Plaza52
Most opposite parks
Furthest in metric space. Useful for recognising what kind of park this isn’t.
- Trca Lands ( 26)Ravine / Naturalized Park27
- Toronto Islands - Muggs Island ParkRavine / Naturalized Park25
- Rouge ParkRavine / Naturalized Park28
- Rouge ParkWaterfront Park25
- Rouge ParkRavine / Naturalized Park26
Visitor signals
Public attention measured by Google Places aggregates. This proxies attention, not occupancy. Aggregate-only: no usernames, no review text, no extra photos beyond the cached hero.
p76 citywide · p86 within Urban Plaza
Source: Google Places API · match unverified (0.00 composite confidence) · last refreshed 5/9/2026. Privacy contract. Measures public attention, not occupancy.
Human activity signals: not available
No activity signals have landed for this park yet. The model has scored its physical form but it can’t yet say how often it’s programmed, photographed, or walked through. See /data-ethics for what we will and will not collect.
Does this score feel accurate?
Your read of Graham Parkmatters. We’re testing whether the model lines up with how people actually use the park. Submissions are stored locally; no account needed.
Tell us how this park feels
We measure structure (canopy, edges, connectivity). You measure feeling. Both matter, and disagreement is itself useful civic data.
What would improve this park?
Generated from the weakest measured dimensions: a starting point, not a prescription.
- Diversify what people can do in the park (playground, washroom, water, shade, performance, sport, garden): even small additions raise this score.
- Increase canopy and reduce paved area. Shade and water features extend usable hours and seasons.
Data sources
- City of Toronto Open Data: Parks (Green Space)Polygon boundaries, official names, types.
- Parks & Recreation FacilitiesInventory of in-park amenities (washrooms, fields, rinks…).
- Toronto Pedestrian NetworkSidewalk segments around and through parks; estimated park entrances.
- Toronto Centreline V2Street segments + intersection nodes near park edges; trails and walkways.
- Toronto 3D MassingBuilding footprints + heights for edge-building counts, frontage density, and tower-in-the-park risk.
- Toronto Treed AreaTree canopy share inside park polygons via stratified-grid sampling.
- Toronto Waterbodies & RiversWater surface inside parks + nearest-water distance for cooling.
- Ravine & Natural Feature ProtectionRavine overlap as a cooling / natural-comfort signal.
- Toronto Street Tree InventoryTree count + density inside park polygons.
- Neighbourhood Profiles(Pending) Equity context proxy.
- OpenStreetMap (Overpass API)Cafés, restaurants, retail, transit stops, parking, highways, rail.