St. Andrew'S Playground
Urban Plaza, in the top tier overall (score 46, rank ~90th percentile). Strongest: connectivity; weakest: natural comfort.
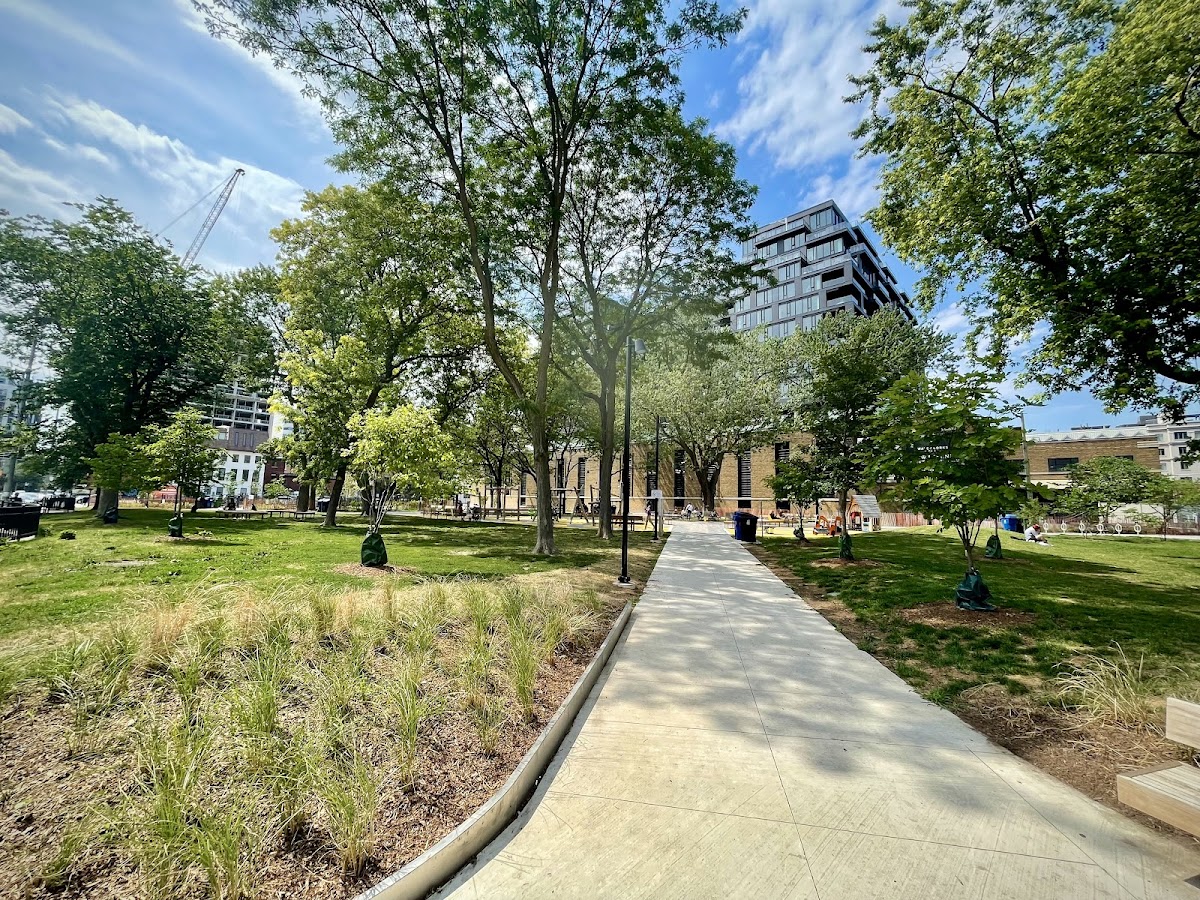
Photo by Darcy via Google Places · cached 5/9/2026
St. Andrew'S Playground scores 45.8 / 100. Strongest dimensions: enclosure / eyes on park and connectivity. Weakest: edge activation (14). Border-vacuum risk is low. This score is a transparent reading of Jane Jacobs-style vitality factors, not a definitive judgment.
Area · 0.59 ha
Weighted across six dimensions · confidence 68%
Scores are not bell-curved. Percentiles and expected scores provide context without changing the underlying model.
Loading map…
The parks map is loading.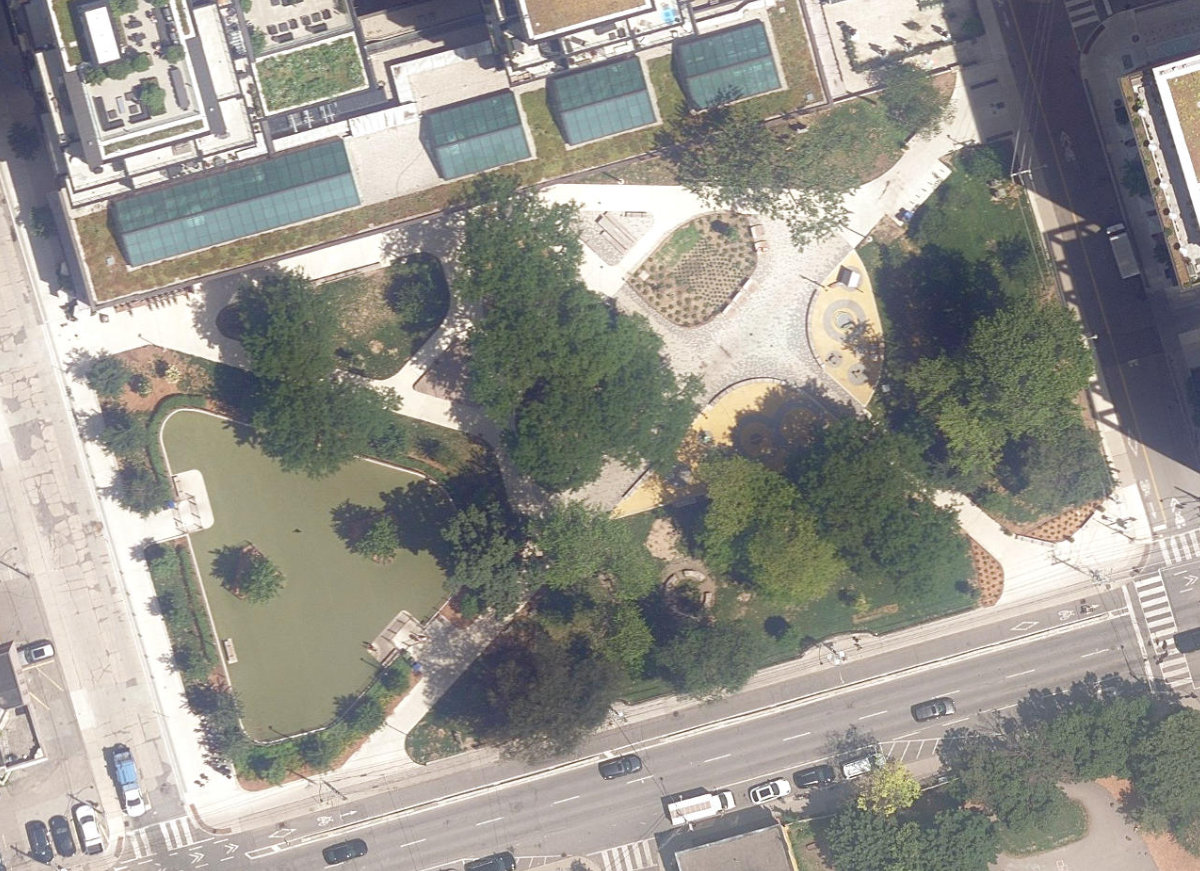
Explain this score
Where did the 46 come from? Each weighted contribution against a neutral 50 baseline. Green = pushed up; red = pulled down.
Sum of contributions = the headline score. A negative bar means that dimension dragged the park below the city-wide neutral baseline.
Why this park works
St. Andrew'S Playground works because its connectivity score (79) is one of the city's strongest and its enclosure (87) is also top decile (26 transit stops sit within a 400 m walk; 22 intersections fall within 100 m of the edge).
What limits this park
.
Most distinctive characteristic
Most distinctive feature: exceptionally high connectivity (79, top decile).
Jacobs reading
St. Andrew'S Playground sits between an urban social park and an ecological retreat: moderately useful for both, exceptionally suited to neither.
Tradeoffs
- Connectivity (79) significantly outpaces natural comfort (39): well placed in the city but offers little shade or ecological respite.
- The park is enclosed by buildings (87) but the surrounding streets are quiet (edge activation 14): frame without animation.
- 11 nearby towers cast wind and shadow without contributing canopy: passive surveillance is plentiful but human-scale comfort is not.
Performance in context
- A modest overperformer for its urban plaza typology (+7 vs the median in small Urban Plaza).
Typology classification
Classified as Urban Plaza: 5907 m², paved (0% canopy), 17.5 buildings/100 m
Edge Activation
Within 100 m of the park edge: 14 active uses (cafe, restaurant, retail, school) and 7 dead/hostile uses (parking_lot). Active edges keep "eyes on the park" through the day; parking lots, blank institutional walls, rail and highway frontages drain street life.
Source: OSM POIs (amenity/shop) + Toronto Building Footprints + land use
Connectivity
Connectivity blends paths, intersections, transit, entrances, and edge density. This park has 23 mapped paths/walkways and 21 sidewalk segments within 50 m; 22 street intersections within 100 m; 26 transit stops within a 400 m walk; 5 estimated access points across ~320 m of perimeter. edge density is healthy, no superblock penalty. Source coverage: centreline, pedestrian_network, transit_osm.
Source: Toronto Centreline V2 + Pedestrian Network + OSM transit stops
Amenity Diversity
2 distinct amenity types in the park (dog_area, playground). Diversity, not raw count, drives the score so a park with many distinct activity types can outrank a larger park that repeats the same use.
Source: Toronto Parks & Recreation Facilities + OSM amenity tags
Natural Comfort
Natural-comfort components for this park: ~6.3% effective canopy (0.0% from contiguous tree polygons + scattered tree density); nearest waterbody ~1121 m; 9 city-mapped trees inside the polygon (9.0/ha). Reading: exposed. Source coverage: waterbodies, street_trees. Impervious surface is approximated (Toronto's authoritative layer ships only as a raster GeoTIFF).
Source: Toronto Treed Area + Ravine + Waterbodies + Street Tree Inventory
Enclosure / Eyes on Park
56 buildings within 25 m of the park edge (31 mid-rise, 14 low-rise, 11 tower); avg edge height 21.1 m (~7 floors); 17.5 buildings per 100 m of 320 m perimeter (strong frontage density); edges lean tall but still framed; 11 towers ≥ 40 m within 25 m of the edge. "Eyes on the park" come strongest from the 31 mid-rise edge buildings.
Source: Toronto 3D Massing (building footprints + heights)
Border Vacuum Risk
Border-vacuum factors within 50 m of the park: parking_lot, parking_lot. Jacobs warned that highways, rail, parking lots and blank institutional edges act as "vacuums" that suppress foot traffic and isolate the park from its neighbourhood.
Source: Toronto Street Centreline (highways) + rail layer + OSM landuse + building footprints
Equity Context
Equity Context requires inputs not yet loaded for this park (Toronto Neighbourhood Profiles). Score is held at a neutral 50 with low confidence. Read with caution.
Source: Toronto Neighbourhood Profiles
Amenities (2 types · 2 records)
- dog area
- playground
Nearby active-edge features (80)
- retail: Rotblott's Discount Warehouse23 m
- retail: Cops treats23 m
- restaurant: Impact24 m
- parking lot26 m
- restaurant: Nutbar33 m
- parking lot34 m
- restaurant: nutbar35 m
- restaurant: Lee Restaurant55 m
- restaurant: UNIUN60 m
- school: Oasis Alternative Secondary School61 m
- parking lot61 m
- parking lot62 m
- retail: Sobr Market Richmond63 m
- retail: Mankind Grooming69 m
- parking lot70 m
- retail: Pryntco Toronto72 m
- parking lot78 m
- retail: Mankind Grooming81 m
- parking lot82 m
- cafe: Fahrenheit Coffee91 m
- restaurant: Jacobs & Co. Steakhouse98 m
- cafe: Jimmy's Coffee103 m
- restaurant: Campechano Taqueria104 m
- retail: Astley Gilbert107 m
- cafe: Forget Me Not Cafe109 m
- parking lot114 m
- restaurant: Citizen114 m
- retail: Clay With Me116 m
- restaurant: Little Sister120 m
- restaurant: Wilbur Mexicana134 m
- restaurant: Four Brothers Pizza134 m
- retail136 m
- restaurant: Myth138 m
- restaurant: The Keg140 m
- restaurant: Java House140 m
- restaurant: Belfast Love Public House141 m
- restaurant: Craft Kitchen144 m
- parking lot145 m
- restaurant: VELA145 m
- restaurant: Cibo148 m
- retail: Value Buds149 m
- retail149 m
- retail: Arton Beads149 m
- retail149 m
- retail: Affordable Textiles150 m
- parking lot150 m
- retail: World Sew Centre150 m
- retail: Fresh Picked Fresh Produce & Flowers151 m
- retail: Mama Loves You Vintage151 m
- restaurant: The Grand151 m
- retail: Hi Beads152 m
- retail: On Your Face Optical152 m
- retail152 m
- retail: The Dot152 m
- retail: Freshly Baked Tees152 m
- retail: PC Shop Computers152 m
- retail152 m
- restaurant: Greta153 m
- retail: Comfort Nails153 m
- retail154 m
- retail: Dollarama156 m
- retail: Yes Electric Tattoo157 m
- retail159 m
- retail: mim161 m
- retail: mindzai162 m
- retail: LCBO162 m
- retail: Homebase163 m
- transit stop: Augusta Avenue163 m
- retail: Backdoor163 m
- retail: The Légère Studio164 m
- restaurant: Bar Altura164 m
- restaurant: Añejo164 m
- transit stop: Portland Street165 m
- restaurant: Burrito Boyz165 m
- retail: Brosche Bridal166 m
- transit stop: Augusta Avenue166 m
- retail: Third Floor Tailors167 m
- restaurant: Rosie’s Burger167 m
- retail: The Printing House168 m
- retail: Mokuba170 m
Park profile
Five-axis radar across the structural dimensions.
Citywide percentile ranks
Across all Toronto parks in the dataset.
- Overall vitality90th
- Edge activation71th
- Connectivity98th
- Amenity diversity91th
- Natural comfort36th
- Enclosure94th
Most similar parks
Closest in metric space across the five structural dimensions.
- Felstead Avenue PlaygroundNeighbourhood Park47
- Salem ParketteUrban Plaza37
- Barbara Hall ParkParkette47
- Joel Weeks ParkParkette48
- Westmoreland Avenue ParketteUrban Plaza40
Most opposite parks
Furthest in metric space. Useful for recognising what kind of park this isn’t.
- Toronto Islands - Muggs Island ParkRavine / Naturalized Park25
- Trca Lands ( 26)Ravine / Naturalized Park27
- Rouge ParkRavine / Naturalized Park28
- Rouge ParkWaterfront Park25
- Rouge ParkRavine / Naturalized Park26
Visitor signals
Public attention measured by Google Places aggregates. This proxies attention, not occupancy. Aggregate-only: no usernames, no review text, no extra photos beyond the cached hero.
“Tree-shaded city park featuring a playground, benches & an off-leash area for dogs.” (Google editorial summary)
p87 citywide · p99 within Urban Plaza
Source: Google Places API · match high (1.00 composite confidence) · last refreshed 5/9/2026. Privacy contract. Measures public attention, not occupancy.
Human activity signals: not available
No activity signals have landed for this park yet. The model has scored its physical form but it can’t yet say how often it’s programmed, photographed, or walked through. See /data-ethics for what we will and will not collect.
Does this score feel accurate?
Your read of St. Andrew'S Playgroundmatters. We’re testing whether the model lines up with how people actually use the park. Submissions are stored locally; no account needed.
Tell us how this park feels
We measure structure (canopy, edges, connectivity). You measure feeling. Both matter, and disagreement is itself useful civic data.
What would improve this park?
Generated from the weakest measured dimensions: a starting point, not a prescription.
- Activate the edges: encourage cafés, retail or community uses on the streets that face the park; replace blank or parking-lot edges where possible.
- Diversify what people can do in the park (playground, washroom, water, shade, performance, sport, garden): even small additions raise this score.
- Increase canopy and reduce paved area. Shade and water features extend usable hours and seasons.
Data sources
- City of Toronto Open Data: Parks (Green Space)Polygon boundaries, official names, types.
- Parks & Recreation FacilitiesInventory of in-park amenities (washrooms, fields, rinks…).
- Toronto Pedestrian NetworkSidewalk segments around and through parks; estimated park entrances.
- Toronto Centreline V2Street segments + intersection nodes near park edges; trails and walkways.
- Toronto 3D MassingBuilding footprints + heights for edge-building counts, frontage density, and tower-in-the-park risk.
- Toronto Treed AreaTree canopy share inside park polygons via stratified-grid sampling.
- Toronto Waterbodies & RiversWater surface inside parks + nearest-water distance for cooling.
- Ravine & Natural Feature ProtectionRavine overlap as a cooling / natural-comfort signal.
- Toronto Street Tree InventoryTree count + density inside park polygons.
- Neighbourhood Profiles(Pending) Equity context proxy.
- OpenStreetMap (Overpass API)Cafés, restaurants, retail, transit stops, parking, highways, rail.