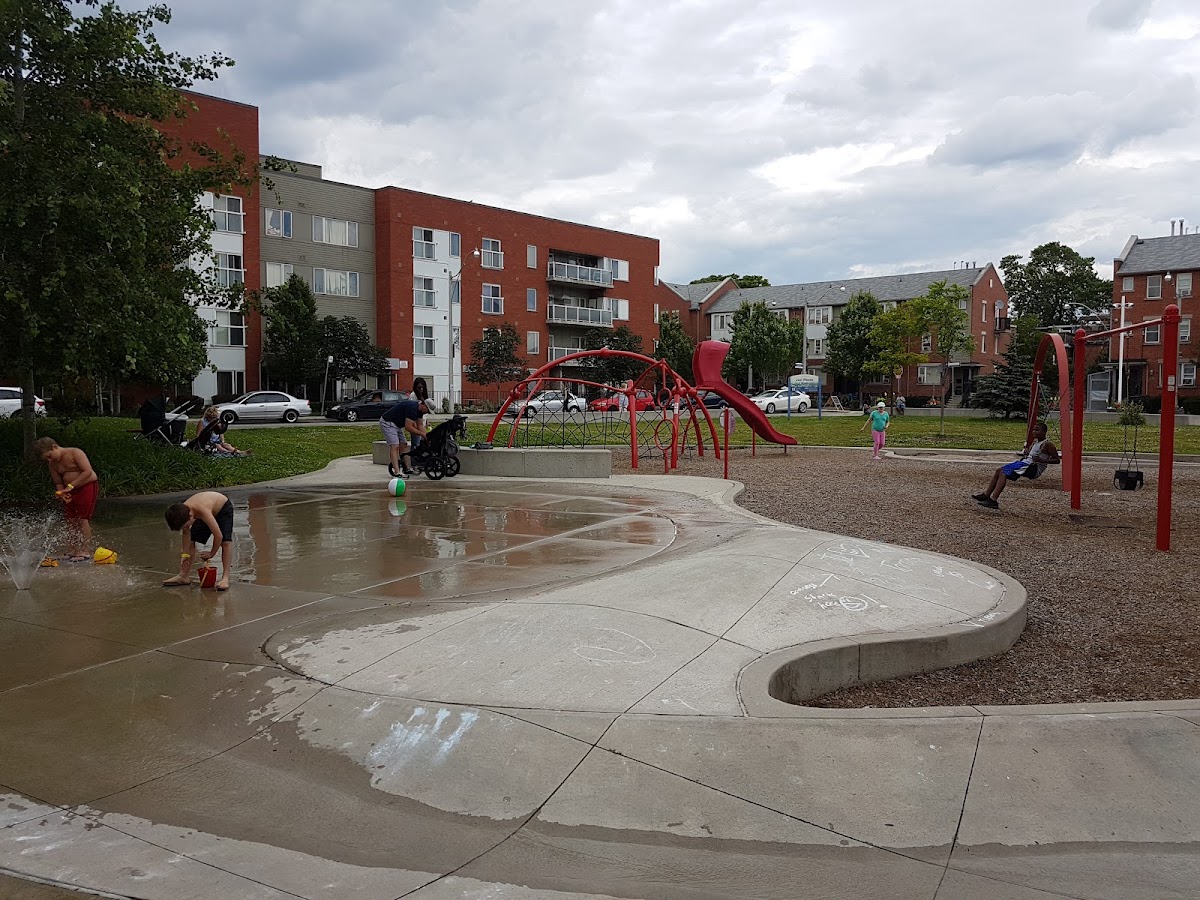
Joel Weeks Park
Parkette, in the top tier overall (score 48, rank ~93th percentile). Strongest: connectivity; weakest: natural comfort.
Photo by Kirk E via Google Places · cached 5/9/2026
Joel Weeks Park scores 47.9 / 100. Strongest dimensions: enclosure / eyes on park and connectivity. Weakest: amenity diversity (21). Border-vacuum risk is elevated (36). This score is a transparent reading of Jane Jacobs-style vitality factors, not a definitive judgment.
Area · 0.95 ha
Weighted across six dimensions · confidence 68%
Scores are not bell-curved. Percentiles and expected scores provide context without changing the underlying model.
Loading map…
The parks map is loading.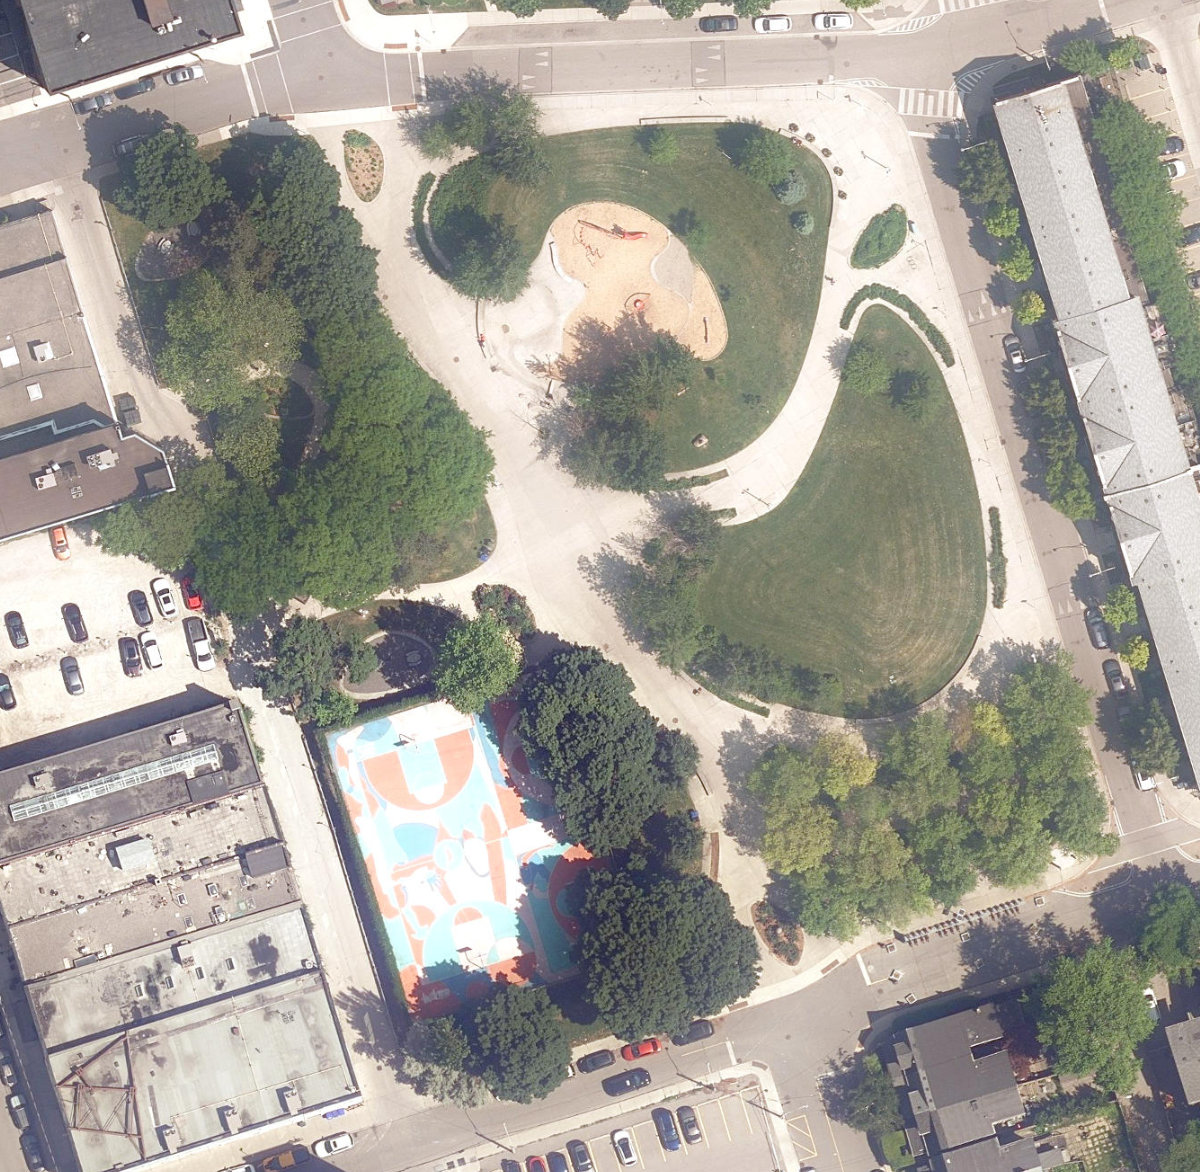
Explain this score
Where did the 48 come from? Each weighted contribution against a neutral 50 baseline. Green = pushed up; red = pulled down.
Sum of contributions = the headline score. A negative bar means that dimension dragged the park below the city-wide neutral baseline.
Why this park works
Joel Weeks Park works because its connectivity score (79) is one of the city's strongest and its enclosure (86) is also top decile (20 transit stops sit within a 400 m walk; 32 intersections fall within 100 m of the edge).
What limits this park
Joel Weeks Park is held back by natural comfort (39, below-average): only 0% canopy means little summer shade; border-vacuum risk is also elevated (36).
Most distinctive characteristic
Most distinctive feature: exceptionally high connectivity (79, top decile).
Jacobs reading
Joel Weeks Park sits between an urban social park and an ecological retreat: moderately useful for both, exceptionally suited to neither.
Tradeoffs
- Connectivity (79) significantly outpaces natural comfort (39): well placed in the city but offers little shade or ecological respite.
Performance in context
- A modest overperformer for its parkette typology (+12 vs the median in small Parkette).
Typology classification
Classified as Parkette: small (9497 m²) with strong building frontage (12.6 per 100 m)
Edge Activation
Within 100 m of the park edge: 19 active uses (retail, restaurant, cafe, transit_stop) and 6 dead/hostile uses (parking_lot). Active edges keep "eyes on the park" through the day; parking lots, blank institutional walls, rail and highway frontages drain street life.
Source: OSM POIs (amenity/shop) + Toronto Building Footprints + land use
Connectivity
Connectivity blends paths, intersections, transit, entrances, and edge density. This park has 9 mapped paths/walkways and 34 sidewalk segments within 50 m; 32 street intersections within 100 m; 20 transit stops within a 400 m walk; 6 estimated access points across ~389 m of perimeter. edge density is healthy, no superblock penalty. Source coverage: centreline, pedestrian_network, transit_osm.
Source: Toronto Centreline V2 + Pedestrian Network + OSM transit stops
Amenity Diversity
2 distinct amenity types in the park (basketball, playground). Diversity, not raw count, drives the score so a park with many distinct activity types can outrank a larger park that repeats the same use.
Source: Toronto Parks & Recreation Facilities + OSM amenity tags
Natural Comfort
Natural-comfort components for this park: ~3.5% effective canopy (0.0% from contiguous tree polygons + scattered tree density); nearest waterbody ~140 m; 5 city-mapped trees inside the polygon (5.0/ha). Reading: water-cooled. Source coverage: waterbodies, street_trees. Impervious surface is approximated (Toronto's authoritative layer ships only as a raster GeoTIFF).
Source: Toronto Treed Area + Ravine + Waterbodies + Street Tree Inventory
Enclosure / Eyes on Park
49 buildings within 25 m of the park edge (24 mid-rise, 25 low-rise, 0 tower); avg edge height 8.9 m (~3 floors); 12.6 buildings per 100 m of 389 m perimeter (strong frontage density); edges are low-rise (mostly 2 to 3 floors); no towers immediately adjacent. "Eyes on the park" come strongest from the 24 mid-rise edge buildings.
Source: Toronto 3D Massing (building footprints + heights)
Border Vacuum Risk
Border-vacuum factors within 50 m of the park: parking_lot, parking_lot, parking_lot. Jacobs warned that highways, rail, parking lots and blank institutional edges act as "vacuums" that suppress foot traffic and isolate the park from its neighbourhood.
Source: Toronto Street Centreline (highways) + rail layer + OSM landuse + building footprints
Equity Context
Equity Context requires inputs not yet loaded for this park (Toronto Neighbourhood Profiles). Score is held at a neutral 50 with low confidence. Read with caution.
Source: Toronto Neighbourhood Profiles
Amenities (2 types · 2 records)
- basketball
- playground
Nearby active-edge features (59)
- parking lot22 m
- parking lot25 m
- parking lot35 m
- retail51 m
- retail: Amavi Atelier68 m
- cafe: Dark Horse Espresso Bar69 m
- parking lot70 m
- parking lot70 m
- retail: Motorcade Industries Inc71 m
- retail: Isle Tattoo74 m
- retail: Guff76 m
- retail: INS Market76 m
- retail83 m
- retail85 m
- transit stop: Carroll Street87 m
- transit stop: Carroll Street87 m
- restaurant: White Lily Dinner91 m
- restaurant: Pizza Pizza95 m
- retail: Blackbird Bakery98 m
- retail: Album Hair99 m
- retail: The Cannonball99 m
- retail: Broadview Hot Yoga99 m
- parking lot100 m
- retail: Ride Away Bikes100 m
- retail: East Toronto Foot Care100 m
- retail: Kalamkaar101 m
- highway: Don Valley Parkway102 m
- highway: Don Valley Parkway104 m
- restaurant: il ponte109 m
- restaurant: Ali Baba's109 m
- parking lot116 m
- restaurant: Aura116 m
- restaurant: Riverside Burgers120 m
- retail: Downtown Toyota Pre-owned125 m
- parking lot129 m
- restaurant: Prohibition Gastrohouse133 m
- retail: Red Label Tattoo134 m
- restaurant: Wendy's142 m
- retail: Canna Cabana146 m
- restaurant: Eastbound Brewing Company151 m
- restaurant: Happy Burger155 m
- retail: Toyota Downtown156 m
- restaurant: The Broadview Bistro+Bar158 m
- restaurant: The Rooftop162 m
- transit stop: Broadview Avenue164 m
- restaurant: The Civic165 m
- restaurant: The West Cork167 m
- transit stop: Queen Street East169 m
- retail: St John's Bakery176 m
- parking lot179 m
- retail: Starbank Convenience Mart180 m
- retail: Downtown Lincoln/Downtown Ford189 m
- restaurant: Pizza Nova189 m
- highway: Don Valley Parkway191 m
- retail: Audi Downtown Toronto192 m
- parking lot193 m
- restaurant: Liberty Shawarma196 m
- parking lot196 m
- retail: Genesis Downtown197 m
Park profile
Five-axis radar across the structural dimensions.
Citywide percentile ranks
Across all Toronto parks in the dataset.
- Overall vitality93th
- Edge activation86th
- Connectivity98th
- Amenity diversity88th
- Natural comfort35th
- Enclosure92th
Most similar parks
Closest in metric space across the five structural dimensions.
- Osler PlaygroundParkette49
- Victoria Memorial Square ParkCivic Square47
- Dundas - St.Clarens ParketteUrban Plaza47
- Barbara Hall ParkParkette47
- Westmoreland Avenue ParketteUrban Plaza40
Most opposite parks
Furthest in metric space. Useful for recognising what kind of park this isn’t.
- Trca Lands ( 26)Ravine / Naturalized Park27
- Toronto Islands - Muggs Island ParkRavine / Naturalized Park25
- Rouge ParkRavine / Naturalized Park28
- Rouge ParkWaterfront Park25
- Rouge ParkRavine / Naturalized Park26
Visitor signals
Public attention measured by Google Places aggregates. This proxies attention, not occupancy. Aggregate-only: no usernames, no review text, no extra photos beyond the cached hero.
p74 citywide · p83 within Parkette
Source: Google Places API · match high (0.99 composite confidence) · last refreshed 5/9/2026. Privacy contract. Measures public attention, not occupancy.
Human activity signals: not available
No activity signals have landed for this park yet. The model has scored its physical form but it can’t yet say how often it’s programmed, photographed, or walked through. See /data-ethics for what we will and will not collect.
Does this score feel accurate?
Your read of Joel Weeks Parkmatters. We’re testing whether the model lines up with how people actually use the park. Submissions are stored locally; no account needed.
Tell us how this park feels
We measure structure (canopy, edges, connectivity). You measure feeling. Both matter, and disagreement is itself useful civic data.
What would improve this park?
Generated from the weakest measured dimensions: a starting point, not a prescription.
- Activate the edges: encourage cafés, retail or community uses on the streets that face the park; replace blank or parking-lot edges where possible.
- Diversify what people can do in the park (playground, washroom, water, shade, performance, sport, garden): even small additions raise this score.
- Increase canopy and reduce paved area. Shade and water features extend usable hours and seasons.
- Mitigate border vacuums (highways, rail, parking) with active programming on the still-permeable edges and treat the hostile edge as a design challenge.
Data sources
- City of Toronto Open Data: Parks (Green Space)Polygon boundaries, official names, types.
- Parks & Recreation FacilitiesInventory of in-park amenities (washrooms, fields, rinks…).
- Toronto Pedestrian NetworkSidewalk segments around and through parks; estimated park entrances.
- Toronto Centreline V2Street segments + intersection nodes near park edges; trails and walkways.
- Toronto 3D MassingBuilding footprints + heights for edge-building counts, frontage density, and tower-in-the-park risk.
- Toronto Treed AreaTree canopy share inside park polygons via stratified-grid sampling.
- Toronto Waterbodies & RiversWater surface inside parks + nearest-water distance for cooling.
- Ravine & Natural Feature ProtectionRavine overlap as a cooling / natural-comfort signal.
- Toronto Street Tree InventoryTree count + density inside park polygons.
- Neighbourhood Profiles(Pending) Equity context proxy.
- OpenStreetMap (Overpass API)Cafés, restaurants, retail, transit stops, parking, highways, rail.