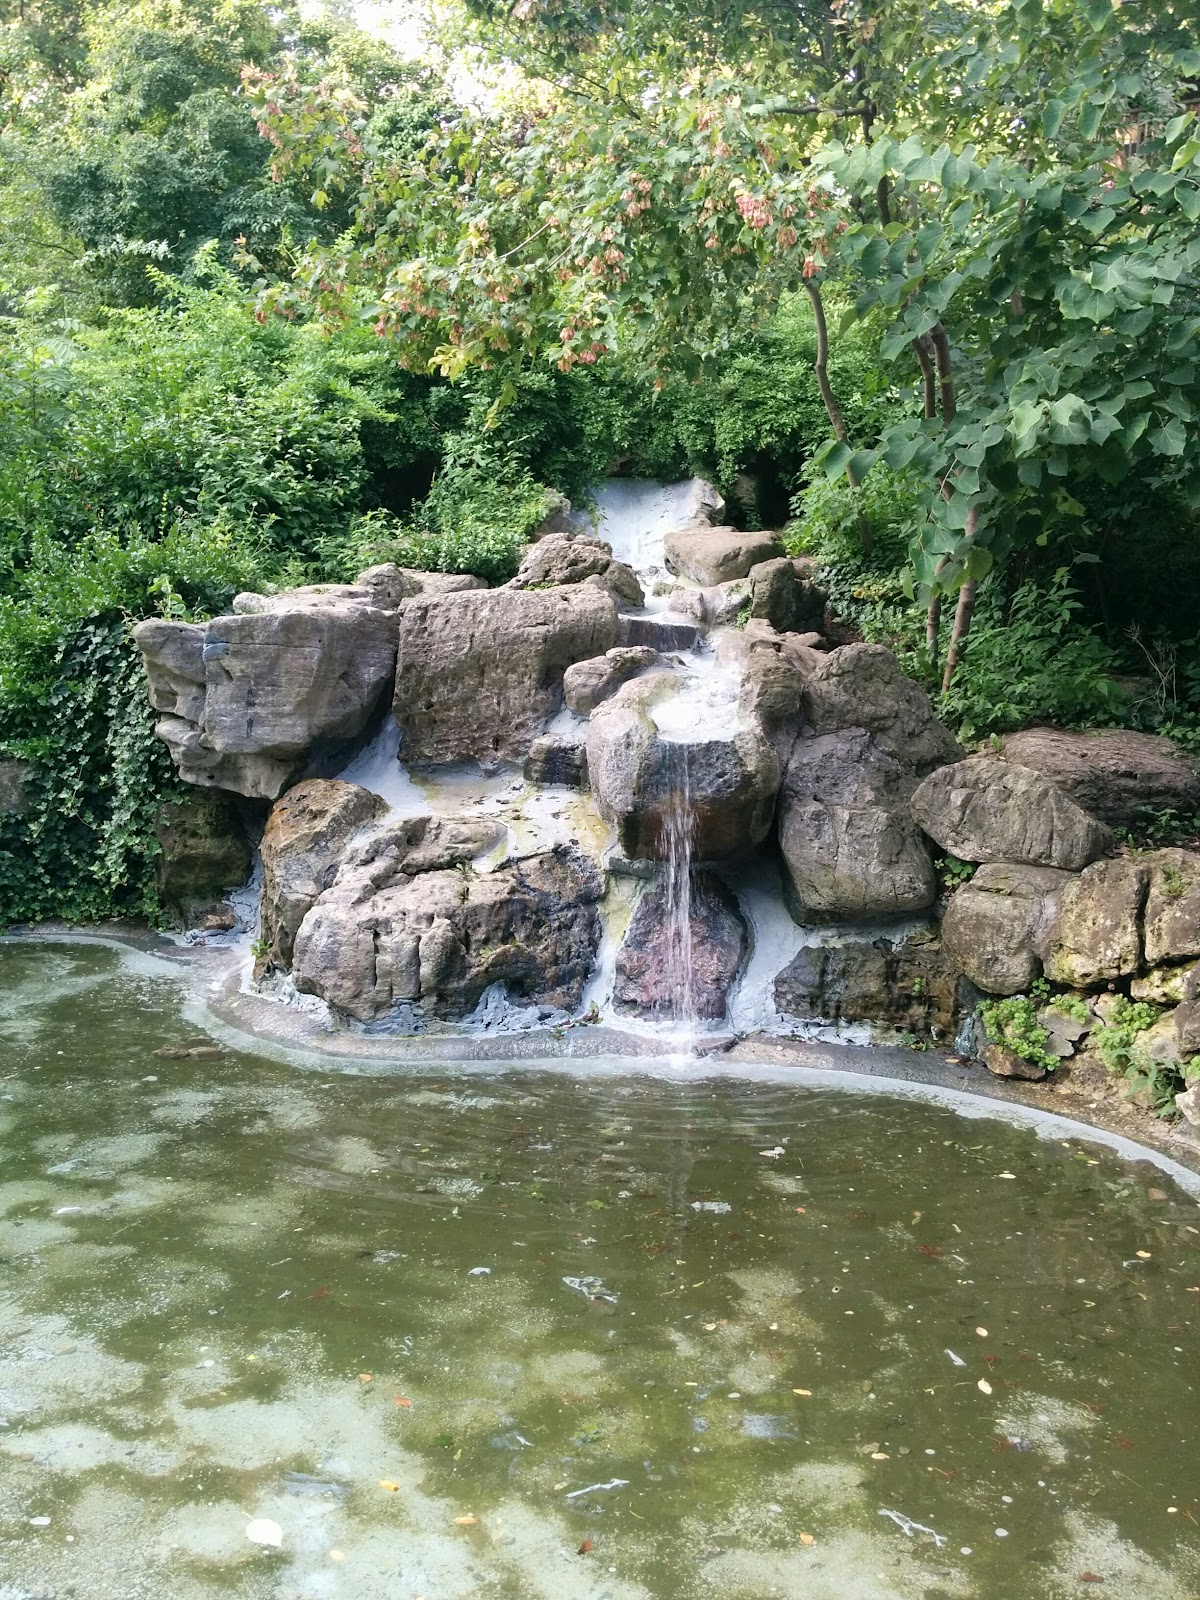
Ivan Forrest Gardens
Ravine / Naturalized Park, one of the city's strongest overall (score 58, rank ~99th percentile). Strongest: edge activation; weakest: natural comfort.
Photo by Randy McDonald via Google Places · cached 5/9/2026
Ivan Forrest Gardens scores 57.5 / 100. Strongest dimensions: enclosure / eyes on park and connectivity. Weakest: amenity diversity (11.9). Border-vacuum risk is low. This score is a transparent reading of Jane Jacobs-style vitality factors, not a definitive judgment.
Area · 0.49 ha
Weighted across six dimensions · confidence 68%
Scores are not bell-curved. Percentiles and expected scores provide context without changing the underlying model.
Loading map…
The parks map is loading.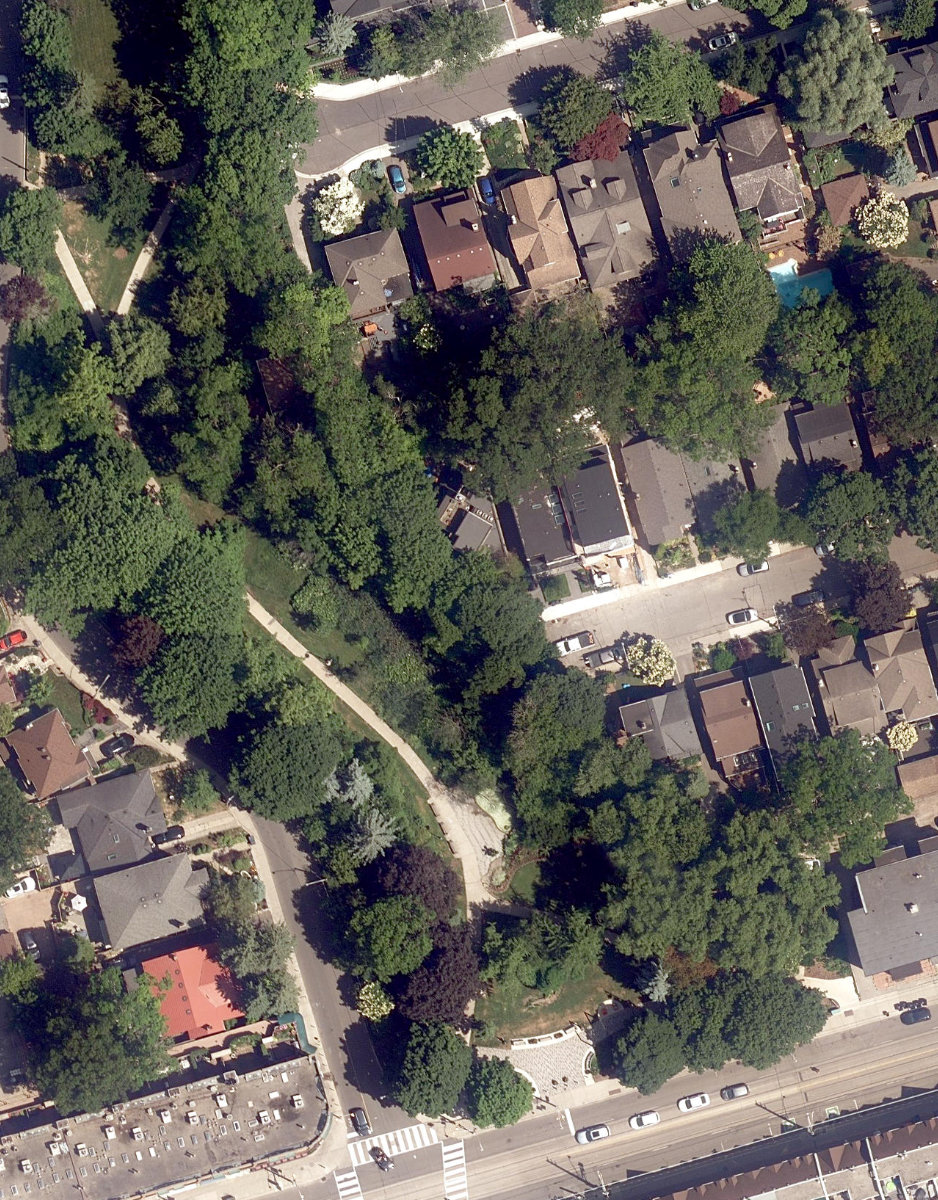
Explain this score
Where did the 58 come from? Each weighted contribution against a neutral 50 baseline. Green = pushed up; red = pulled down.
Sum of contributions = the headline score. A negative bar means that dimension dragged the park below the city-wide neutral baseline.
Why this park works
Ivan Forrest Gardens works because its edge activation score (52) is one of the city's strongest and its connectivity (76) is also top decile (its perimeter is lined with active uses).
What limits this park
Ivan Forrest Gardens doesn't have a clear weakness. Every measured dimension is at or above the middle of the pack.
Most distinctive characteristic
Most distinctive feature: exceptionally high edge activation (52, top decile).
Jacobs reading
Ivan Forrest Gardens sits between an urban social park and an ecological retreat: moderately useful for both, exceptionally suited to neither.
Performance in context
- This park is a strong overperformer for its cohort: raw 58 versus an expected 32 for similar parks (small Ravine / Naturalized Park ravine) (gap +25).
Typology classification
Classified as Ravine / Naturalized Park: 97% ravine overlap, 0% canopy. Secondary read: Urban Plaza (4874 m², paved (0% canopy), 27.1 buildings/100 m).
Edge Activation
Within 100 m of the park edge: 13 active uses (restaurant, retail, transit_stop) and 2 dead/hostile uses (parking_lot). Active edges keep "eyes on the park" through the day; parking lots, blank institutional walls, rail and highway frontages drain street life.
Source: OSM POIs (amenity/shop) + Toronto Building Footprints + land use
Connectivity
Connectivity blends paths, intersections, transit, entrances, and edge density. This park has 11 mapped paths/walkways and 31 sidewalk segments within 50 m; 16 street intersections within 100 m; 12 transit stops within a 400 m walk; 10 estimated access points across ~432 m of perimeter. edge density is healthy, no superblock penalty. Source coverage: centreline, pedestrian_network, transit_osm.
Source: Toronto Centreline V2 + Pedestrian Network + OSM transit stops
Amenity Diversity
1 distinct amenity types in the park (picnic). Diversity, not raw count, drives the score so a park with many distinct activity types can outrank a larger park that repeats the same use.
Source: Toronto Parks & Recreation Facilities + OSM amenity tags
Natural Comfort
Natural-comfort components for this park: ~13.3% effective canopy (0.0% from contiguous tree polygons + scattered tree density); 97.1% inside the ravine system; nearest waterbody ~418 m; 19 city-mapped trees inside the polygon (19.0/ha). Reading: ravine-cooled. Source coverage: ravine, waterbodies, street_trees. Impervious surface is approximated (Toronto's authoritative layer ships only as a raster GeoTIFF).
Source: Toronto Treed Area + Ravine + Waterbodies + Street Tree Inventory
Enclosure / Eyes on Park
117 buildings within 25 m of the park edge (11 mid-rise, 106 low-rise, 0 tower); avg edge height 6.5 m (~2 floors); 27.1 buildings per 100 m of 432 m perimeter (strong frontage density); edges are low-rise (mostly 2 to 3 floors); no towers immediately adjacent. "Eyes on the park" come strongest from the 11 mid-rise edge buildings.
Source: Toronto 3D Massing (building footprints + heights)
Border Vacuum Risk
Park edges face the city. No significant border vacuum detected.
Source: Toronto Street Centreline (highways) + rail layer + OSM landuse + building footprints
Equity Context
Equity Context requires inputs not yet loaded for this park (Toronto Neighbourhood Profiles). Score is held at a neutral 50 with low confidence. Read with caution.
Source: Toronto Neighbourhood Profiles
Amenities (1 types · 1 records)
- picnic
Nearby active-edge features (30)
- transit stop: Glen Manor Drive8 m
- retail: U Design Gallery22 m
- retail: Roula & Thomas Hair Salon22 m
- restaurant: Swiss Chalet Express25 m
- retail: Royal LePage26 m
- transit stop: Glen Manor Drive27 m
- retail: Home Hardware30 m
- retail: Remax Hallmark44 m
- restaurant: Beacher Cafe56 m
- parking lot68 m
- retail: Hallmark69 m
- retail: The Source77 m
- parking lot79 m
- retail: 4Cats Arts Studio84 m
- retail: Essential Natural Memory Foam Mattresses100 m
- retail: Mastermind Toys109 m
- parking lot: Queen/Hammersmith110 m
- retail: Benjamin Moore114 m
- retail: Tori's Bakeshop120 m
- retail: Sleep Country131 m
- retail: The UPS Store139 m
- retail: Hasty Market141 m
- restaurant: Pizzaiolo150 m
- school: Sandpiper Montessori School153 m
- retail: Rowe Beach Market166 m
- retail: Arts on Queen174 m
- retail: Flirt your Inner Beauty177 m
- retail: Florathecary181 m
- school: Toronto Nature School186 m
- restaurant: Yumei Sushi197 m
Park profile
Five-axis radar across the structural dimensions.
Citywide percentile ranks
Across all Toronto parks in the dataset.
- Overall vitality99th
- Edge activation97th
- Connectivity97th
- Amenity diversity83th
- Natural comfort74th
- Enclosure82th
Most similar parks
Closest in metric space across the five structural dimensions.
- Perth Square ParkCivic Square56
- Parliament Square ParkCivic Square52
- Toronto Music GardenNeighbourhood Park53
- Art Eggleton ParkUrban Plaza56
- Bickford ParkRavine / Naturalized Park58
Most opposite parks
Furthest in metric space. Useful for recognising what kind of park this isn’t.
- Toronto Islands - Muggs Island ParkRavine / Naturalized Park25
- Rouge ParkRavine / Naturalized Park21
- Trca Lands ( 26)Ravine / Naturalized Park27
- Rouge ParkRavine / Naturalized Park18
- Trca Lands ( 58)Waterfront Park18
Visitor signals
Public attention measured by Google Places aggregates. This proxies attention, not occupancy. Aggregate-only: no usernames, no review text, no extra photos beyond the cached hero.
p84 citywide · p83 within Ravine / Naturalized Park
Source: Google Places API · match unverified (0.00 composite confidence) · last refreshed 5/9/2026. Privacy contract. Measures public attention, not occupancy.
Human activity signals: not available
No activity signals have landed for this park yet. The model has scored its physical form but it can’t yet say how often it’s programmed, photographed, or walked through. See /data-ethics for what we will and will not collect.
Does this score feel accurate?
Your read of Ivan Forrest Gardensmatters. We’re testing whether the model lines up with how people actually use the park. Submissions are stored locally; no account needed.
Tell us how this park feels
We measure structure (canopy, edges, connectivity). You measure feeling. Both matter, and disagreement is itself useful civic data.
What would improve this park?
Generated from the weakest measured dimensions: a starting point, not a prescription.
- Diversify what people can do in the park (playground, washroom, water, shade, performance, sport, garden): even small additions raise this score.
Data sources
- City of Toronto Open Data: Parks (Green Space)Polygon boundaries, official names, types.
- Parks & Recreation FacilitiesInventory of in-park amenities (washrooms, fields, rinks…).
- Toronto Pedestrian NetworkSidewalk segments around and through parks; estimated park entrances.
- Toronto Centreline V2Street segments + intersection nodes near park edges; trails and walkways.
- Toronto 3D MassingBuilding footprints + heights for edge-building counts, frontage density, and tower-in-the-park risk.
- Toronto Treed AreaTree canopy share inside park polygons via stratified-grid sampling.
- Toronto Waterbodies & RiversWater surface inside parks + nearest-water distance for cooling.
- Ravine & Natural Feature ProtectionRavine overlap as a cooling / natural-comfort signal.
- Toronto Street Tree InventoryTree count + density inside park polygons.
- Neighbourhood Profiles(Pending) Equity context proxy.
- OpenStreetMap (Overpass API)Cafés, restaurants, retail, transit stops, parking, highways, rail.