Parliament Square Park
Civic Square, one of the city's strongest overall (score 52, rank ~97th percentile). Strongest: edge activation; weakest: amenity diversity.
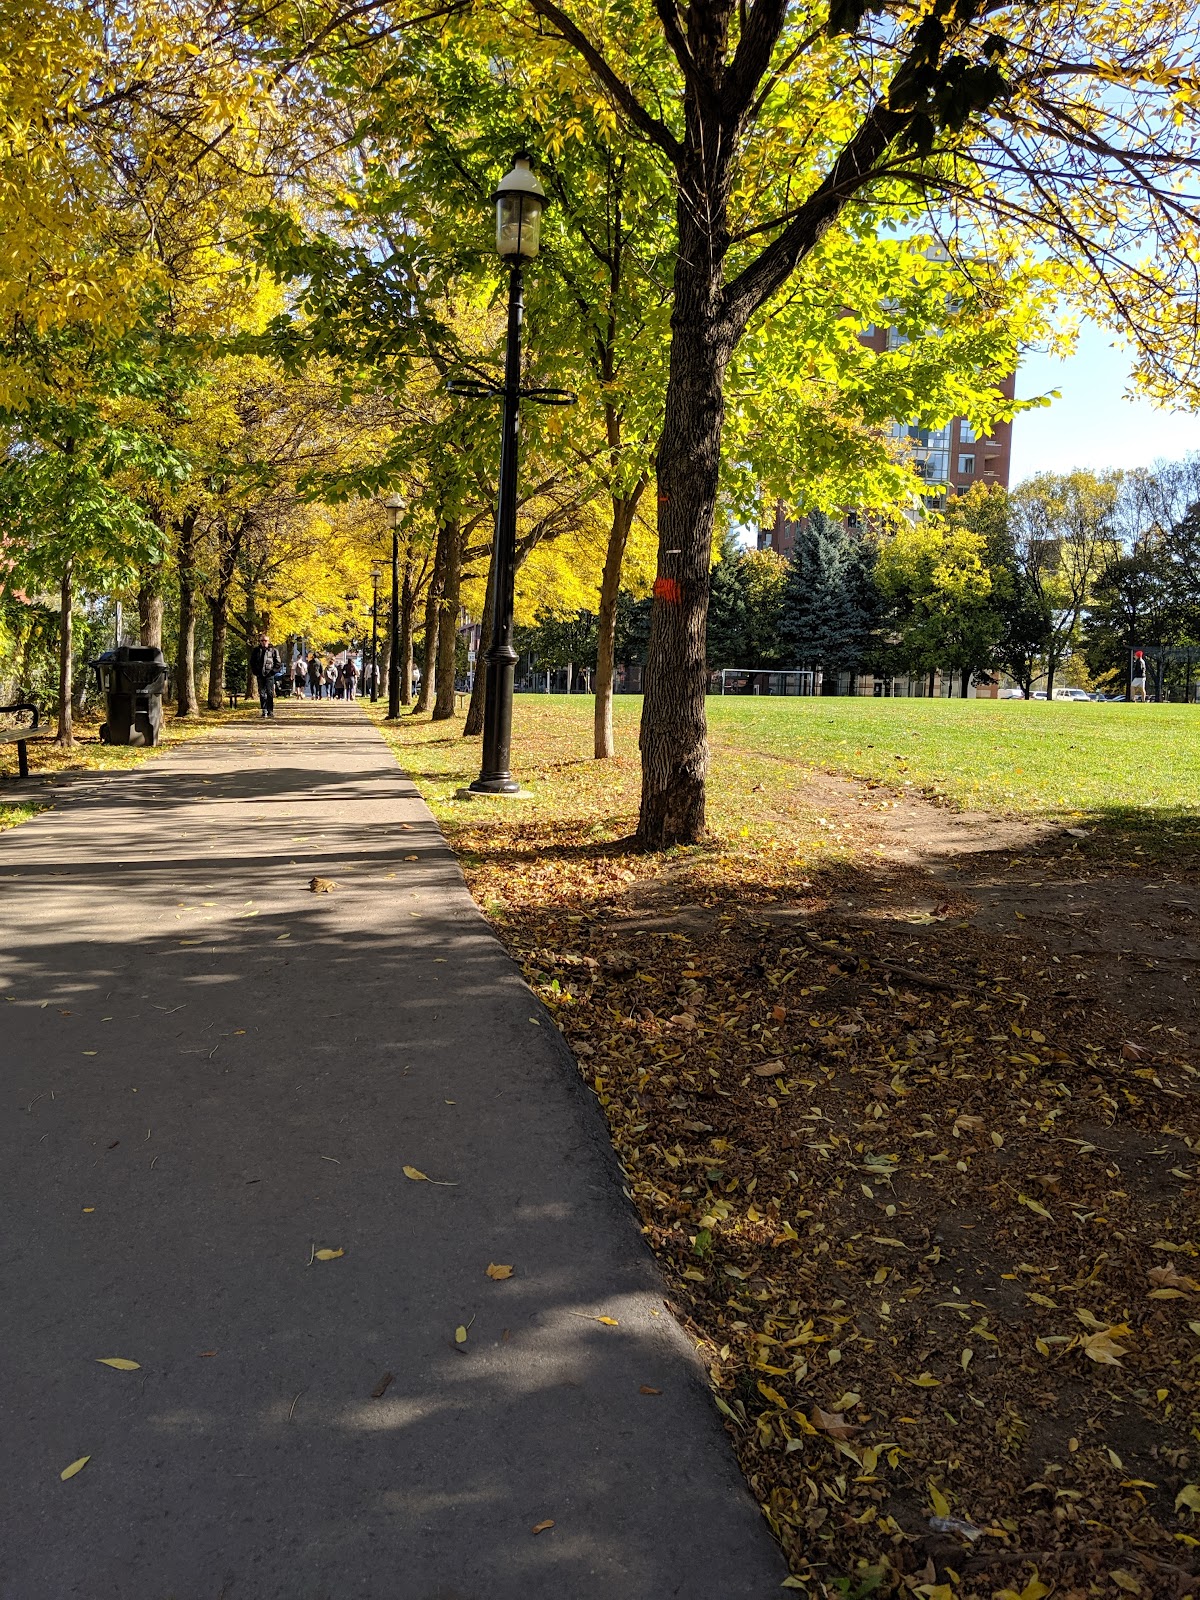
Photo by Android Dave via Google Places · cached 5/9/2026
Parliament Square Park scores 52 / 100. Strongest dimensions: enclosure / eyes on park and connectivity. Weakest: amenity diversity (0). Border-vacuum risk is low. This score is a transparent reading of Jane Jacobs-style vitality factors, not a definitive judgment.
Area · 0.93 ha
Weighted across six dimensions · confidence 59%
Scores are not bell-curved. Percentiles and expected scores provide context without changing the underlying model.
Loading map…
The parks map is loading.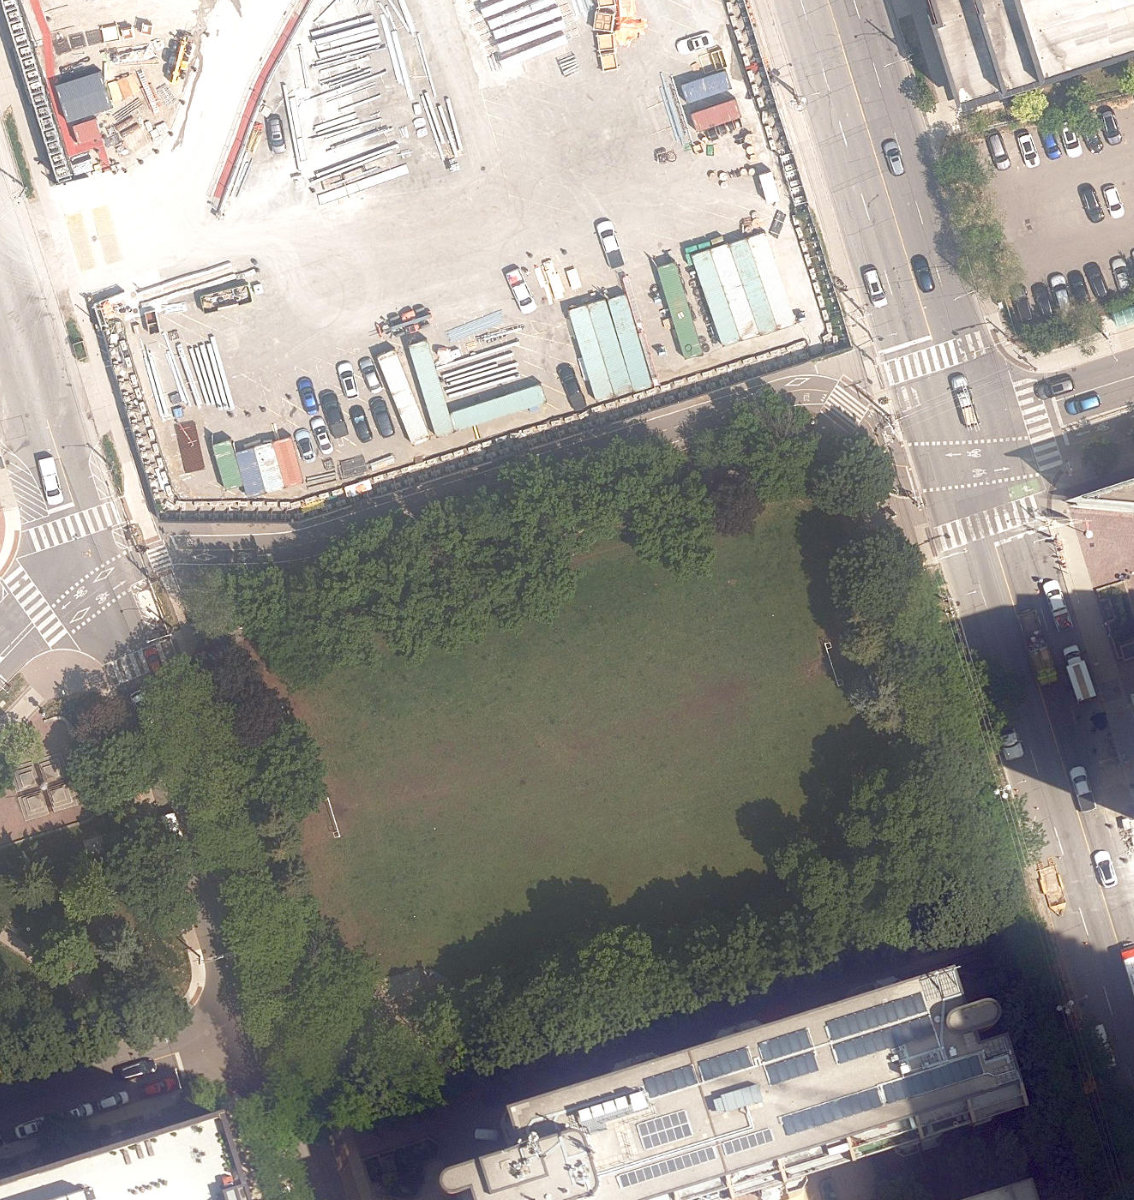
Explain this score
Where did the 52 come from? Each weighted contribution against a neutral 50 baseline. Green = pushed up; red = pulled down.
Sum of contributions = the headline score. A negative bar means that dimension dragged the park below the city-wide neutral baseline.
Why this park works
Parliament Square Park works because its edge activation score (46) is in the top tier and its connectivity (73) is also top decile.
What limits this park
Parliament Square Park doesn't have a clear weakness. Every measured dimension is at or above the middle of the pack.
Most distinctive characteristic
Most distinctive feature: exceptionally high edge activation (46, top decile).
Jacobs reading
Parliament Square Park sits between an urban social park and an ecological retreat: moderately useful for both, exceptionally suited to neither.
Performance in context
- A modest overperformer for its civic square typology (+10 vs the median in small Civic Square).
Typology classification
Classified as Civic Square: name flags as civic square + 18 buildings frame the edge
Edge Activation
Within 100 m of the park edge: 14 active uses (transit_stop, cafe, retail, community) and 3 dead/hostile uses (parking_lot). Active edges keep "eyes on the park" through the day; parking lots, blank institutional walls, rail and highway frontages drain street life.
Source: OSM POIs (amenity/shop) + Toronto Building Footprints + land use
Connectivity
Connectivity blends paths, intersections, transit, entrances, and edge density. This park has 2 mapped paths/walkways and 22 sidewalk segments within 50 m; 11 street intersections within 100 m; 32 transit stops within a 400 m walk; 6 estimated access points across ~402 m of perimeter. edge density is healthy, no superblock penalty. Source coverage: centreline, pedestrian_network, transit_osm.
Source: Toronto Centreline V2 + Pedestrian Network + OSM transit stops
Amenity Diversity
No amenities recorded. Score is 0 until inventory is loaded.
Source: Toronto Parks & Recreation Facilities + OSM amenity tags
Natural Comfort
Natural-comfort components for this park: ~20.3% effective canopy (0.0% from contiguous tree polygons + scattered tree density); nearest waterbody ~350 m; 29 city-mapped trees inside the polygon (29.0/ha). Reading: exposed. Source coverage: waterbodies, street_trees. Impervious surface is approximated (Toronto's authoritative layer ships only as a raster GeoTIFF).
Source: Toronto Treed Area + Ravine + Waterbodies + Street Tree Inventory
Enclosure / Eyes on Park
18 buildings within 25 m of the park edge (13 mid-rise, 4 low-rise, 1 tower); avg edge height 20.1 m (~7 floors); 4.5 buildings per 100 m of 402 m perimeter (strong frontage density); edges are at a Jacobs-scale walkable mid-rise (3 to 7 floors); 1 tower ≥ 40 m within 25 m of the edge. "Eyes on the park" come strongest from the 13 mid-rise edge buildings.
Source: Toronto 3D Massing (building footprints + heights)
Border Vacuum Risk
Park edges face the city. No significant border vacuum detected.
Source: Toronto Street Centreline (highways) + rail layer + OSM landuse + building footprints
Equity Context
Equity Context requires inputs not yet loaded for this park (Toronto Neighbourhood Profiles). Score is held at a neutral 50 with low confidence. Read with caution.
Source: Toronto Neighbourhood Profiles
Amenities (0)
No amenities recorded for this park.
Nearby active-edge features (61)
- transit stop: Mill Street2 m
- transit stop: The Esplanade18 m
- retail: Eurodesign Kitchen & Bath29 m
- community: Jamii29 m
- transit stop: Parliament Street34 m
- cafe: Berkeley Cafe39 m
- retail: Artemide41 m
- transit stop: Berkeley Street48 m
- cafe: Arvo Coffee63 m
- retail: Canary District Presentation Centre68 m
- retail72 m
- transit stop: Front Street East76 m
- transit stop: Front Street East78 m
- parking lot81 m
- parking lot86 m
- parking lot94 m
- cafe: St. Lawrence Cafe96 m
- transit stop: Parliament Street104 m
- parking lot107 m
- transit stop: Berkeley Street120 m
- restaurant: The Fermenting Cellar121 m
- cafe: Cacao 79 distillery126 m
- cafe: Starbucks127 m
- transit stop: Front Street East131 m
- restaurant: The Burger's Priest131 m
- parking lot132 m
- rail: Union Station Rail Corridor138 m
- parking lot139 m
- rail: Union Station Rail Corridor142 m
- rail: Union Station Rail Corridor146 m
- rail: Union Station Rail Corridor150 m
- rail: Union Station Rail Corridor154 m
- community: St. Lawrence Community Recreation Centre156 m
- rail: Union Station Rail Corridor158 m
- rail: Union Station Rail Corridor158 m
- parking lot160 m
- rail: Union Station Rail Corridor163 m
- retail: Dollarama167 m
- rail: Union Station Rail Corridor168 m
- rail: Union Station Rail Corridor169 m
- rail: Union Station Rail Corridor169 m
- parking lot169 m
- restaurant: IZUMI Brewery - Ontario Spring Water Sake169 m
- rail: Union Station Rail Corridor171 m
- rail: Union Station Rail Corridor178 m
- rail: Union Station Rail Corridor179 m
- parking lot181 m
- retail: Royal Foodland181 m
- rail: Union Station Rail Corridor188 m
- retail: LCBO188 m
- parking lot190 m
- retail: Chrysler Dodge Jeep Ram Toronto Parking190 m
- rail: Union Station Rail Corridor191 m
- retail: John Fluevog191 m
- restaurant: Subway193 m
- parking lot194 m
- parking lot196 m
- rail: Union Station Rail Corridor197 m
- retail: Spirt of York Distillery Co.198 m
- rail: Union Station Rail Corridor199 m
- retail: Gingko Floral Design200 m
Park profile
Five-axis radar across the structural dimensions.
Citywide percentile ranks
Across all Toronto parks in the dataset.
- Overall vitality97th
- Edge activation95th
- Connectivity93th
- Amenity diversity47th
- Natural comfort66th
- Enclosure84th
Most similar parks
Closest in metric space across the five structural dimensions.
- Alexander Street ParketteUrban Plaza47
- Kiwanis ParketteRavine / Naturalized Park49
- WATERFRONT NEIGHBOURHOOD CENTRE - Building GroundsWaterfront Park49
- Toronto Music GardenNeighbourhood Park53
- Casimir Traffic IslandUrban Plaza46
Most opposite parks
Furthest in metric space. Useful for recognising what kind of park this isn’t.
- Toronto Islands - Muggs Island ParkRavine / Naturalized Park25
- Trca Lands ( 26)Ravine / Naturalized Park27
- Rouge ParkRavine / Naturalized Park21
- Rouge ParkWaterfront Park25
- Rouge ParkRavine / Naturalized Park26
Visitor signals
Public attention measured by Google Places aggregates. This proxies attention, not occupancy. Aggregate-only: no usernames, no review text, no extra photos beyond the cached hero.
p38 citywide · p21 within Civic Square
Source: Google Places API · match unverified (0.00 composite confidence) · last refreshed 5/9/2026. Privacy contract. Measures public attention, not occupancy.
Human activity signals: not available
No activity signals have landed for this park yet. The model has scored its physical form but it can’t yet say how often it’s programmed, photographed, or walked through. See /data-ethics for what we will and will not collect.
Does this score feel accurate?
Your read of Parliament Square Parkmatters. We’re testing whether the model lines up with how people actually use the park. Submissions are stored locally; no account needed.
Tell us how this park feels
We measure structure (canopy, edges, connectivity). You measure feeling. Both matter, and disagreement is itself useful civic data.
What would improve this park?
Generated from the weakest measured dimensions: a starting point, not a prescription.
- Activate the edges: encourage cafés, retail or community uses on the streets that face the park; replace blank or parking-lot edges where possible.
- Diversify what people can do in the park (playground, washroom, water, shade, performance, sport, garden): even small additions raise this score.
Data sources
- City of Toronto Open Data: Parks (Green Space)Polygon boundaries, official names, types.
- Parks & Recreation FacilitiesInventory of in-park amenities (washrooms, fields, rinks…).
- Toronto Pedestrian NetworkSidewalk segments around and through parks; estimated park entrances.
- Toronto Centreline V2Street segments + intersection nodes near park edges; trails and walkways.
- Toronto 3D MassingBuilding footprints + heights for edge-building counts, frontage density, and tower-in-the-park risk.
- Toronto Treed AreaTree canopy share inside park polygons via stratified-grid sampling.
- Toronto Waterbodies & RiversWater surface inside parks + nearest-water distance for cooling.
- Ravine & Natural Feature ProtectionRavine overlap as a cooling / natural-comfort signal.
- Toronto Street Tree InventoryTree count + density inside park polygons.
- Neighbourhood Profiles(Pending) Equity context proxy.
- OpenStreetMap (Overpass API)Cafés, restaurants, retail, transit stops, parking, highways, rail.