Ellesmere Park
Other, below average overall (score 29, rank ~25th percentile). Strongest: amenity diversity; weakest: enclosure.
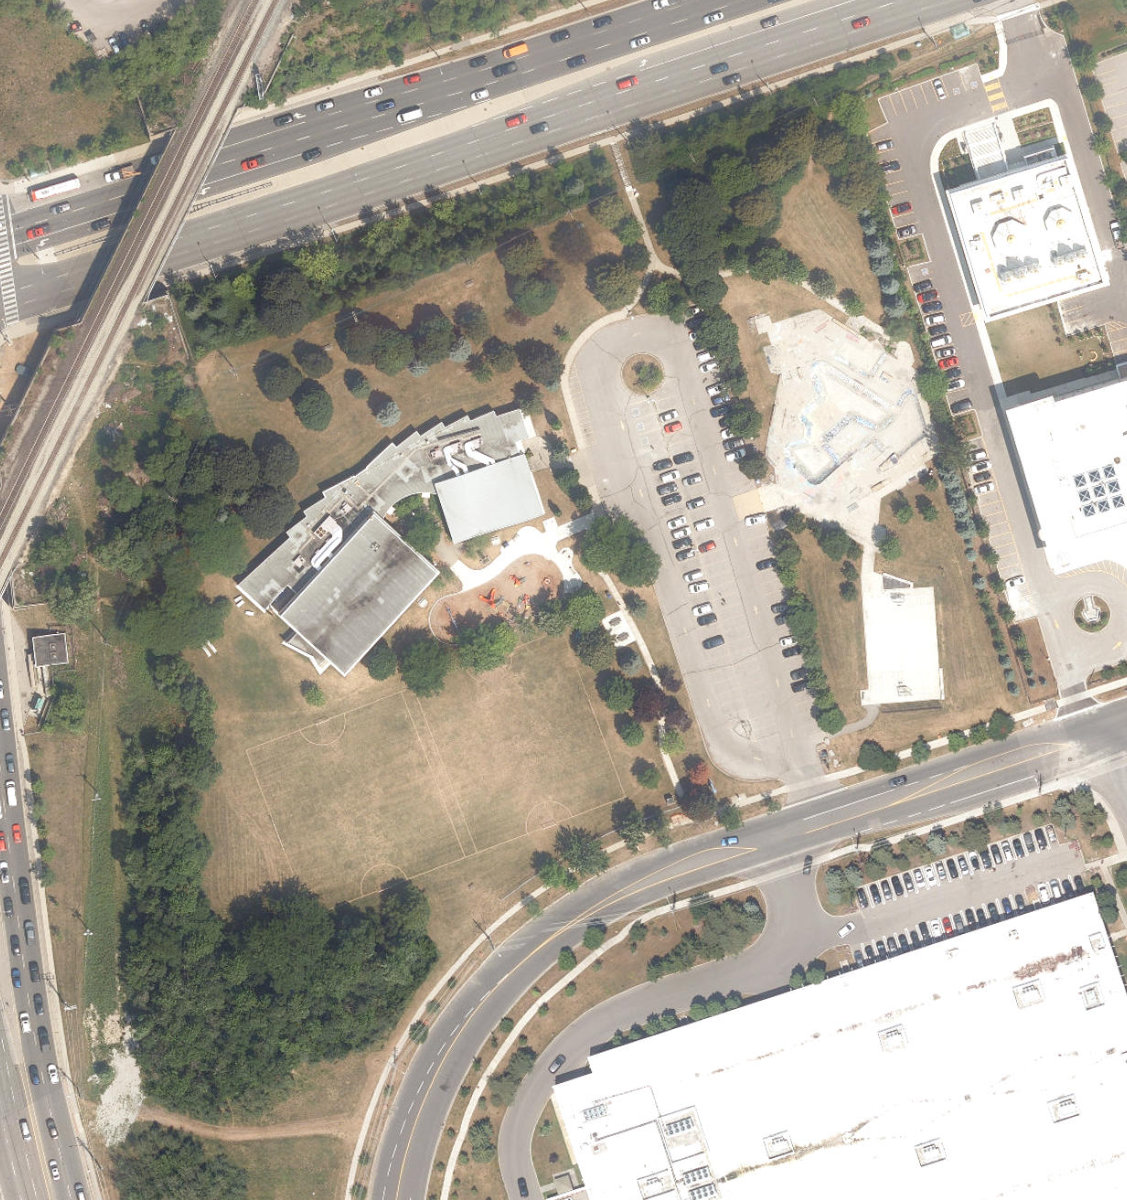
Aerial, City of Toronto orthophoto, ~8 cm/px source · cached 5/9/2026
Ellesmere Park scores 28.8 / 100. Strongest dimensions: connectivity and natural comfort. Weakest: edge activation (0). Border-vacuum risk is elevated (72). This score is a transparent reading of Jane Jacobs-style vitality factors, not a definitive judgment.
Area · 2.81 ha
Weighted across six dimensions · confidence 68%
Scores are not bell-curved. Percentiles and expected scores provide context without changing the underlying model.
Loading map…
The parks map is loading.Explain this score
Where did the 29 come from? Each weighted contribution against a neutral 50 baseline. Green = pushed up; red = pulled down.
Sum of contributions = the headline score. A negative bar means that dimension dragged the park below the city-wide neutral baseline.
Why this park works
Ellesmere Park works because its amenity diversity score (28) is one of the city's strongest.
What limits this park
Ellesmere Park is held back by enclosure (38, bottom quartile): no mid-rise frontage to provide eyes on the park; border-vacuum risk is also elevated (72).
Most distinctive characteristic
Most distinctive feature: exceptionally high amenity diversity (28, top decile).
Jacobs reading
Ellesmere Park is currently underperforming on both axes: neither integrated into the city nor offering deep natural respite. A candidate for design intervention.
Performance in context
- Although its citywide rank is low (25th), it ranks highly among similar others (66th): strong for what it is, even if the absolute score is moderate.
Typology classification
Classified as Other: does not meet any specific typology threshold (2.8 ha, 3 amenity types, frontage 1.3/100m)
Edge Activation
Within 100 m of the park edge: 8 active uses (transit_stop, restaurant) and 14 dead/hostile uses (parking_lot, rail). Active edges keep "eyes on the park" through the day; parking lots, blank institutional walls, rail and highway frontages drain street life.
Source: OSM POIs (amenity/shop) + Toronto Building Footprints + land use
Connectivity
Connectivity blends paths, intersections, transit, entrances, and edge density. This park has 8 mapped paths/walkways and 12 sidewalk segments within 50 m; 5 street intersections within 100 m; 13 transit stops within a 400 m walk; 2 estimated access points across ~752 m of perimeter. low edge density, significant superblock penalty applied. Source coverage: centreline, pedestrian_network, transit_osm.
Source: Toronto Centreline V2 + Pedestrian Network + OSM transit stops
Amenity Diversity
3 distinct amenity types in the park (community_centre, playground, skatepark). Diversity, not raw count, drives the score so a park with many distinct activity types can outrank a larger park that repeats the same use.
Source: Toronto Parks & Recreation Facilities + OSM amenity tags
Natural Comfort
Natural-comfort components for this park: ~5.5% effective canopy (0.0% from contiguous tree polygons + scattered tree density); nearest waterbody ~414 m; 22 city-mapped trees inside the polygon (7.8/ha). Reading: exposed. Source coverage: waterbodies, street_trees. Impervious surface is approximated (Toronto's authoritative layer ships only as a raster GeoTIFF).
Source: Toronto Treed Area + Ravine + Waterbodies + Street Tree Inventory
Enclosure / Eyes on Park
10 buildings within 25 m of the park edge (0 mid-rise, 10 low-rise, 0 tower); avg edge height 5.1 m (~2 floors); 1.3 buildings per 100 m of 752 m perimeter (thin frontage with significant blank-edge share); edges are barely there or single-storey; no towers immediately adjacent. "Eyes on the park" come strongest from the 0 mid-rise edge buildings.
Source: Toronto 3D Massing (building footprints + heights)
Border Vacuum Risk
Border-vacuum factors within 50 m of the park: Belleville Subdivision, Belleville Subdivision, parking_lot, parking_lot, parking_lot. Jacobs warned that highways, rail, parking lots and blank institutional edges act as "vacuums" that suppress foot traffic and isolate the park from its neighbourhood.
Source: Toronto Street Centreline (highways) + rail layer + OSM landuse + building footprints
Equity Context
Equity Context requires inputs not yet loaded for this park (Toronto Neighbourhood Profiles). Score is held at a neutral 50 with low confidence. Read with caution.
Source: Toronto Neighbourhood Profiles
Amenities (3 types · 3 records)
- community centre
- playground
- skatepark
Nearby active-edge features (43)
- parking lot0 m
- parking lot4 m
- rail: Belleville Subdivision33 m
- transit stop33 m
- parking lot36 m
- rail: Belleville Subdivision38 m
- transit stop: Warden Avenue at Canadian Road North Side50 m
- transit stop: Warden Avenue at Ellesmere Road53 m
- parking lot61 m
- parking lot63 m
- parking lot75 m
- parking lot75 m
- transit stop: 426 Ellesmere Road75 m
- parking lot75 m
- parking lot75 m
- transit stop: Ellesmere Road at Warden Avenue78 m
- parking lot79 m
- parking lot81 m
- restaurant: V.I.P. Pool & Bar93 m
- parking lot98 m
- transit stop: Warden Avenue at Canadian Road99 m
- transit stop: Ellesmere Road at Warden Avenue100 m
- parking lot103 m
- parking lot103 m
- parking lot104 m
- transit stop: Warden Avenue at Ellesmere Road106 m
- school: Sathya Sai School114 m
- parking lot119 m
- parking lot120 m
- parking lot121 m
- parking lot123 m
- parking lot129 m
- parking lot137 m
- retail: Costco Tire Centre138 m
- restaurant: Costco Food Court138 m
- parking lot140 m
- parking lot141 m
- parking lot143 m
- parking lot158 m
- restaurant: Mamajoun Pizzeria187 m
- parking lot191 m
- parking lot191 m
- parking lot194 m
Park profile
Five-axis radar across the structural dimensions.
Citywide percentile ranks
Across all Toronto parks in the dataset.
- Overall vitality25th
- Edge activation57th
- Connectivity59th
- Amenity diversity95th
- Natural comfort39th
- Enclosure8th
Most similar parks
Closest in metric space across the five structural dimensions.
- Cherry Beach Clarke Beach ParkWaterfront Park31
- Bayview Arena ParkOther35
- Ashbridges Bay ParkWaterfront Park24
- Cherry Beach Sports FieldsWaterfront Park35
- Humber Bay Park WestWaterfront Park27
Most opposite parks
Furthest in metric space. Useful for recognising what kind of park this isn’t.
- Market Lane ParkUrban Plaza63
- ALEX WILSON COMMUNITY GARDEN - Open Green SpaceUrban Plaza59
- Ryerson Community ParkUrban Plaza60
- Bernard Avenue Road AllowanceUrban Plaza54
- Leslie Grove ParkParkette68
Human activity signals: not available
No activity signals have landed for this park yet. The model has scored its physical form but it can’t yet say how often it’s programmed, photographed, or walked through. See /data-ethics for what we will and will not collect.
Does this score feel accurate?
Your read of Ellesmere Parkmatters. We’re testing whether the model lines up with how people actually use the park. Submissions are stored locally; no account needed.
Tell us how this park feels
We measure structure (canopy, edges, connectivity). You measure feeling. Both matter, and disagreement is itself useful civic data.
What would improve this park?
Generated from the weakest measured dimensions: a starting point, not a prescription.
- Activate the edges: encourage cafés, retail or community uses on the streets that face the park; replace blank or parking-lot edges where possible.
- Diversify what people can do in the park (playground, washroom, water, shade, performance, sport, garden): even small additions raise this score.
- Increase canopy and reduce paved area. Shade and water features extend usable hours and seasons.
- Encourage mid-rise, windowed frontages around the park so residents have direct sightlines onto it.
- Mitigate border vacuums (highways, rail, parking) with active programming on the still-permeable edges and treat the hostile edge as a design challenge.
Data sources
- City of Toronto Open Data: Parks (Green Space)Polygon boundaries, official names, types.
- Parks & Recreation FacilitiesInventory of in-park amenities (washrooms, fields, rinks…).
- Toronto Pedestrian NetworkSidewalk segments around and through parks; estimated park entrances.
- Toronto Centreline V2Street segments + intersection nodes near park edges; trails and walkways.
- Toronto 3D MassingBuilding footprints + heights for edge-building counts, frontage density, and tower-in-the-park risk.
- Toronto Treed AreaTree canopy share inside park polygons via stratified-grid sampling.
- Toronto Waterbodies & RiversWater surface inside parks + nearest-water distance for cooling.
- Ravine & Natural Feature ProtectionRavine overlap as a cooling / natural-comfort signal.
- Toronto Street Tree InventoryTree count + density inside park polygons.
- Neighbourhood Profiles(Pending) Equity context proxy.
- OpenStreetMap (Overpass API)Cafés, restaurants, retail, transit stops, parking, highways, rail.