North York Hydro Green Space
Other, middle of the pack overall (score 36, rank ~56th percentile). Strongest: connectivity; weakest: enclosure.
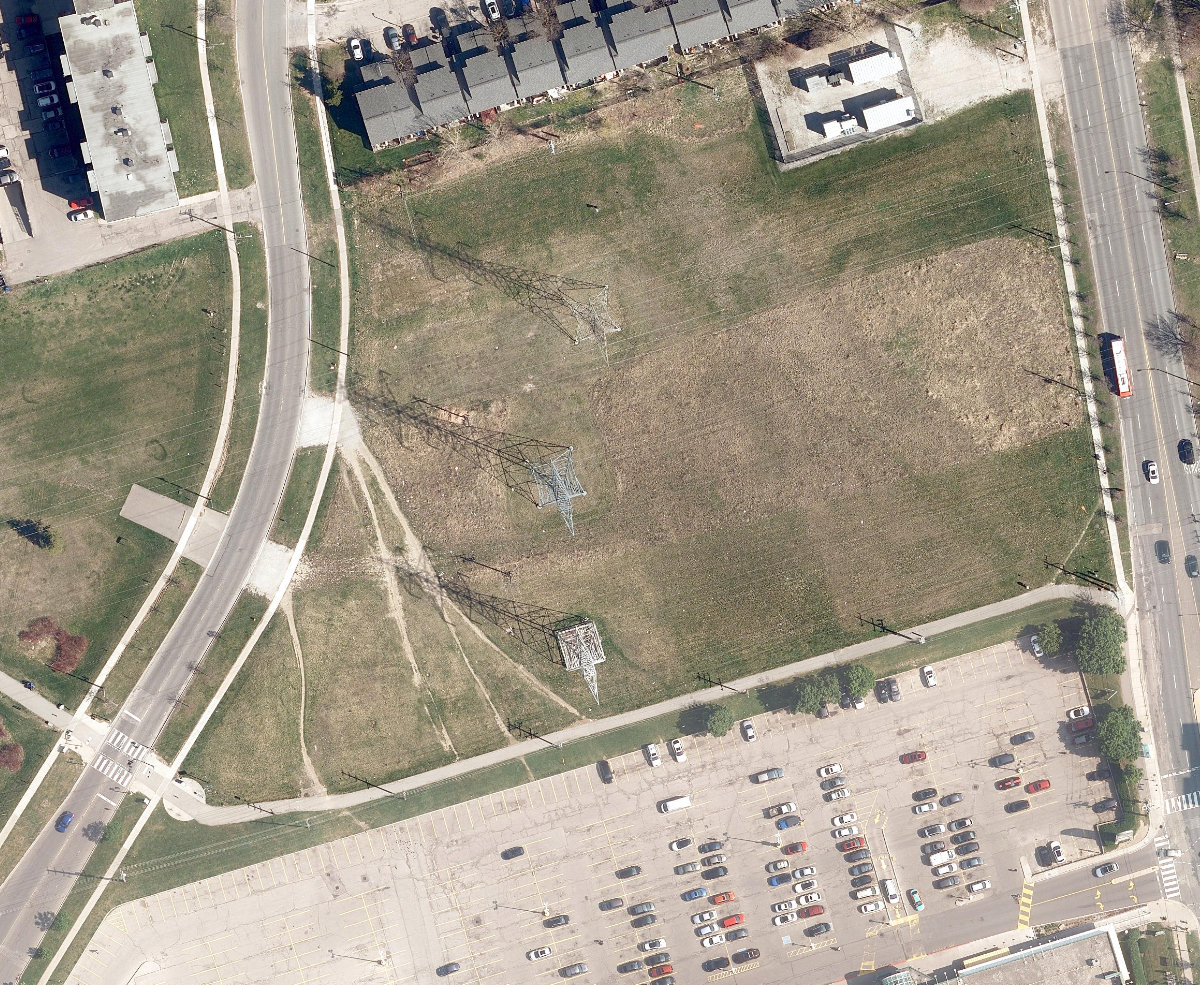
Aerial, City of Toronto orthophoto, ~8 cm/px source · cached 5/9/2026
North York Hydro Green Space scores 35.5 / 100. Strongest dimensions: connectivity and enclosure / eyes on park. Weakest: amenity diversity (0). Border-vacuum risk is low. This score is a transparent reading of Jane Jacobs-style vitality factors, not a definitive judgment.
Area · 1.99 ha
Weighted across six dimensions · confidence 63%
Scores are not bell-curved. Percentiles and expected scores provide context without changing the underlying model.
Loading map…
The parks map is loading.Explain this score
Where did the 36 come from? Each weighted contribution against a neutral 50 baseline. Green = pushed up; red = pulled down.
Sum of contributions = the headline score. A negative bar means that dimension dragged the park below the city-wide neutral baseline.
Why this park works
North York Hydro Green Space works because its connectivity score (63) is above average and its edge activation (14) is also above-average (21 transit stops sit within a 400 m walk).
What limits this park
North York Hydro Green Space is held back by enclosure (41, bottom quartile).
Most distinctive characteristic
Most distinctive feature: exceptionally low enclosure (41, bottom quartile).
Jacobs reading
North York Hydro Green Space sits between an urban social park and an ecological retreat: moderately useful for both, exceptionally suited to neither.
Tradeoffs
- Connectivity (63) significantly outpaces natural comfort (36): well placed in the city but offers little shade or ecological respite.
Performance in context
- A modest overperformer for its other typology (+7 vs the median in medium Other).
- Although its citywide rank is low (57th), it ranks highly among similar others (84th): strong for what it is, even if the absolute score is moderate.
Typology classification
Classified as Other: does not meet any specific typology threshold (2.0 ha, 0 amenity types, frontage 1.2/100m)
Edge Activation
Within 100 m of the park edge: 7 active uses (retail, transit_stop) and 5 dead/hostile uses (parking_lot). Active edges keep "eyes on the park" through the day; parking lots, blank institutional walls, rail and highway frontages drain street life.
Source: OSM POIs (amenity/shop) + Toronto Building Footprints + land use
Connectivity
Connectivity blends paths, intersections, transit, entrances, and edge density. This park has 3 mapped paths/walkways and 20 sidewalk segments within 50 m; 5 street intersections within 100 m; 21 transit stops within a 400 m walk; 4 estimated access points across ~655 m of perimeter. moderate edge density, small superblock penalty applied. Source coverage: centreline, pedestrian_network, transit_osm.
Source: Toronto Centreline V2 + Pedestrian Network + OSM transit stops
Amenity Diversity
No amenities recorded. Score is 0 until inventory is loaded.
Source: Toronto Parks & Recreation Facilities + OSM amenity tags
Natural Comfort
Natural-comfort components for this park: 1.4% estimated tree canopy; nearest waterbody ~553 m; 1 city-mapped trees inside the polygon (0.5/ha). Reading: exposed. Source coverage: treed_area, waterbodies, street_trees. Impervious surface is approximated (Toronto's authoritative layer ships only as a raster GeoTIFF).
Source: Toronto Treed Area + Ravine + Waterbodies + Street Tree Inventory
Enclosure / Eyes on Park
8 buildings within 25 m of the park edge (1 mid-rise, 7 low-rise, 0 tower); avg edge height 6.3 m (~2 floors); 1.2 buildings per 100 m of 655 m perimeter (thin frontage with significant blank-edge share); edges are low-rise (mostly 2 to 3 floors); no towers immediately adjacent. "Eyes on the park" come strongest from the 1 mid-rise edge buildings.
Source: Toronto 3D Massing (building footprints + heights)
Border Vacuum Risk
Park edges face the city. No significant border vacuum detected.
Source: Toronto Street Centreline (highways) + rail layer + OSM landuse + building footprints
Equity Context
Equity Context requires inputs not yet loaded for this park (Toronto Neighbourhood Profiles). Score is held at a neutral 50 with low confidence. Read with caution.
Source: Toronto Neighbourhood Profiles
Amenities (0)
No amenities recorded for this park.
Nearby active-edge features (38)
- transit stop: 4148 Jane St38 m
- parking lot65 m
- parking lot70 m
- parking lot73 m
- retail: Dollarama74 m
- retail: Cellular Point77 m
- parking lot83 m
- transit stop: Jane St at San Romanoway84 m
- retail: Fido89 m
- retail: Koodo96 m
- parking lot98 m
- transit stop: Stong Court98 m
- retail: Optical Valu105 m
- community: The Spot106 m
- retail: Expert Tailoring106 m
- retail: Si Vous Play Sports124 m
- parking lot126 m
- transit stop: Jane St at York Gate Blvd128 m
- parking lot129 m
- restaurant: Caribbean Cuisine146 m
- parking lot146 m
- retail: Spectrum Electronics147 m
- restaurant: China Wok147 m
- retail: Gateway Newstands155 m
- rail156 m
- parking lot157 m
- parking lot160 m
- restaurant: El Greeko160 m
- parking lot161 m
- rail163 m
- restaurant: Top Food167 m
- retail: Ziwa Cell Phones & Computers172 m
- transit stop: Driftwood Ave at Wilmont Drive175 m
- rail179 m
- parking lot182 m
- transit stop: Driftwood Ave at Stong Court184 m
- parking lot195 m
- transit stop: Driftwood Ave at Stong Court199 m
Park profile
Five-axis radar across the structural dimensions.
Citywide percentile ranks
Across all Toronto parks in the dataset.
- Overall vitality56th
- Edge activation71th
- Connectivity78th
- Amenity diversity29th
- Natural comfort27th
- Enclosure9th
Most similar parks
Closest in metric space across the five structural dimensions.
- Downsview ParkOther37
- City Wide Open SpaceTower-Community Green Space32
- Don River WatercourseWaterfront Park32
- Humber Bay Shores ParkWaterfront Park38
- Glendale Memorial GardensWaterfront Park23
Most opposite parks
Furthest in metric space. Useful for recognising what kind of park this isn’t.
- Kew GardensNeighbourhood Park71
- Leslie Grove ParkParkette68
- Joseph Burr Tyrrell ParkUrban Plaza50
- Market Lane ParkUrban Plaza63
- Bernard Avenue Road AllowanceUrban Plaza54
Human activity signals: not available
No activity signals have landed for this park yet. The model has scored its physical form but it can’t yet say how often it’s programmed, photographed, or walked through. See /data-ethics for what we will and will not collect.
Does this score feel accurate?
Your read of North York Hydro Green Spacematters. We’re testing whether the model lines up with how people actually use the park. Submissions are stored locally; no account needed.
Tell us how this park feels
We measure structure (canopy, edges, connectivity). You measure feeling. Both matter, and disagreement is itself useful civic data.
What would improve this park?
Generated from the weakest measured dimensions: a starting point, not a prescription.
- Activate the edges: encourage cafés, retail or community uses on the streets that face the park; replace blank or parking-lot edges where possible.
- Diversify what people can do in the park (playground, washroom, water, shade, performance, sport, garden): even small additions raise this score.
- Increase canopy and reduce paved area. Shade and water features extend usable hours and seasons.
- Encourage mid-rise, windowed frontages around the park so residents have direct sightlines onto it.
Data sources
- City of Toronto Open Data: Parks (Green Space)Polygon boundaries, official names, types.
- Parks & Recreation FacilitiesInventory of in-park amenities (washrooms, fields, rinks…).
- Toronto Pedestrian NetworkSidewalk segments around and through parks; estimated park entrances.
- Toronto Centreline V2Street segments + intersection nodes near park edges; trails and walkways.
- Toronto 3D MassingBuilding footprints + heights for edge-building counts, frontage density, and tower-in-the-park risk.
- Toronto Treed AreaTree canopy share inside park polygons via stratified-grid sampling.
- Toronto Waterbodies & RiversWater surface inside parks + nearest-water distance for cooling.
- Ravine & Natural Feature ProtectionRavine overlap as a cooling / natural-comfort signal.
- Toronto Street Tree InventoryTree count + density inside park polygons.
- Neighbourhood Profiles(Pending) Equity context proxy.
- OpenStreetMap (Overpass API)Cafés, restaurants, retail, transit stops, parking, highways, rail.