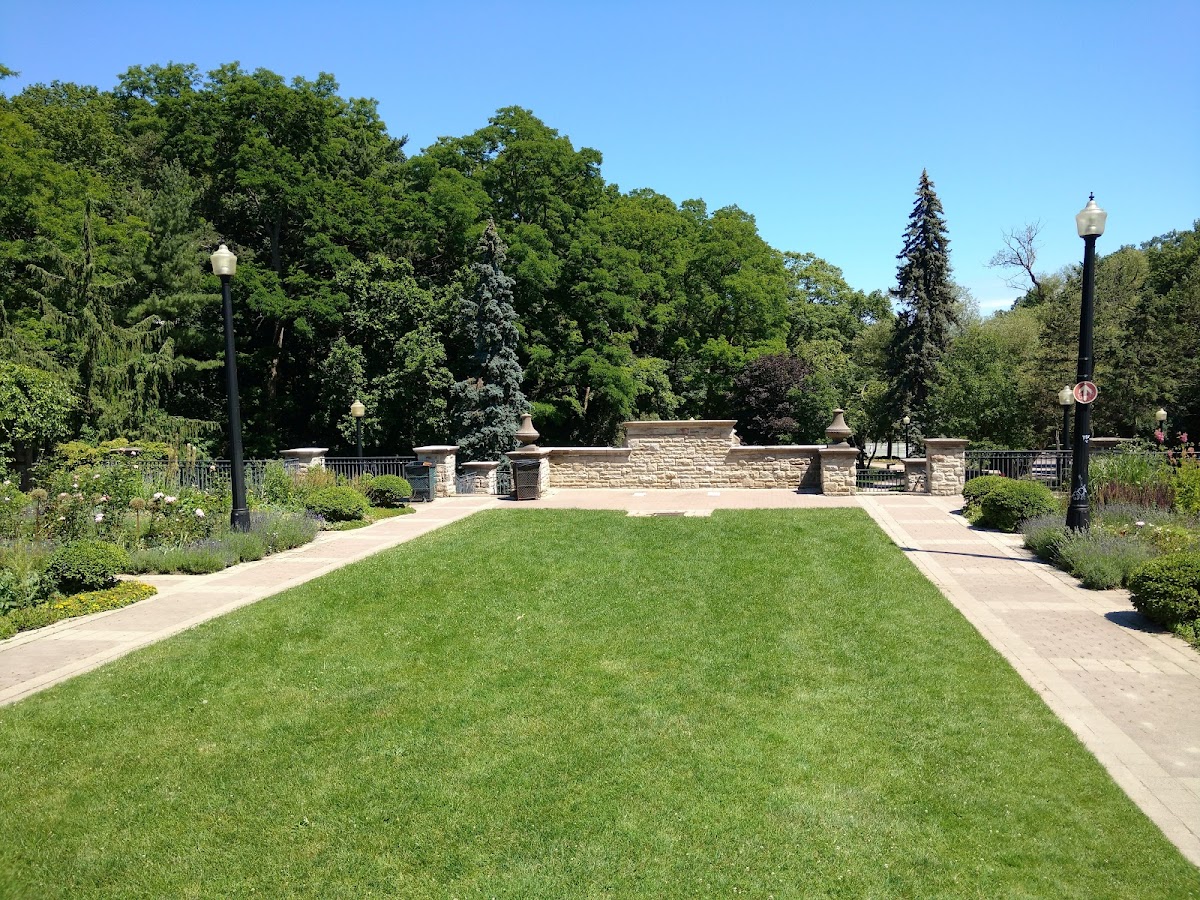
Lawrence Park Ravine
Ravine / Naturalized Park, above average overall (score 41, rank ~80th percentile). Strongest: connectivity; weakest: edge activation.
Photo by Frank D via Google Places · cached 5/9/2026
Lawrence Park Ravine scores 41.4 / 100. Strongest dimensions: enclosure / eyes on park and connectivity. Weakest: edge activation (0). Border-vacuum risk is elevated (100). This score is a transparent reading of Jane Jacobs-style vitality factors, not a definitive judgment.
Area · 4.62 ha
Weighted across six dimensions · confidence 72%
Scores are not bell-curved. Percentiles and expected scores provide context without changing the underlying model.
Loading map…
The parks map is loading.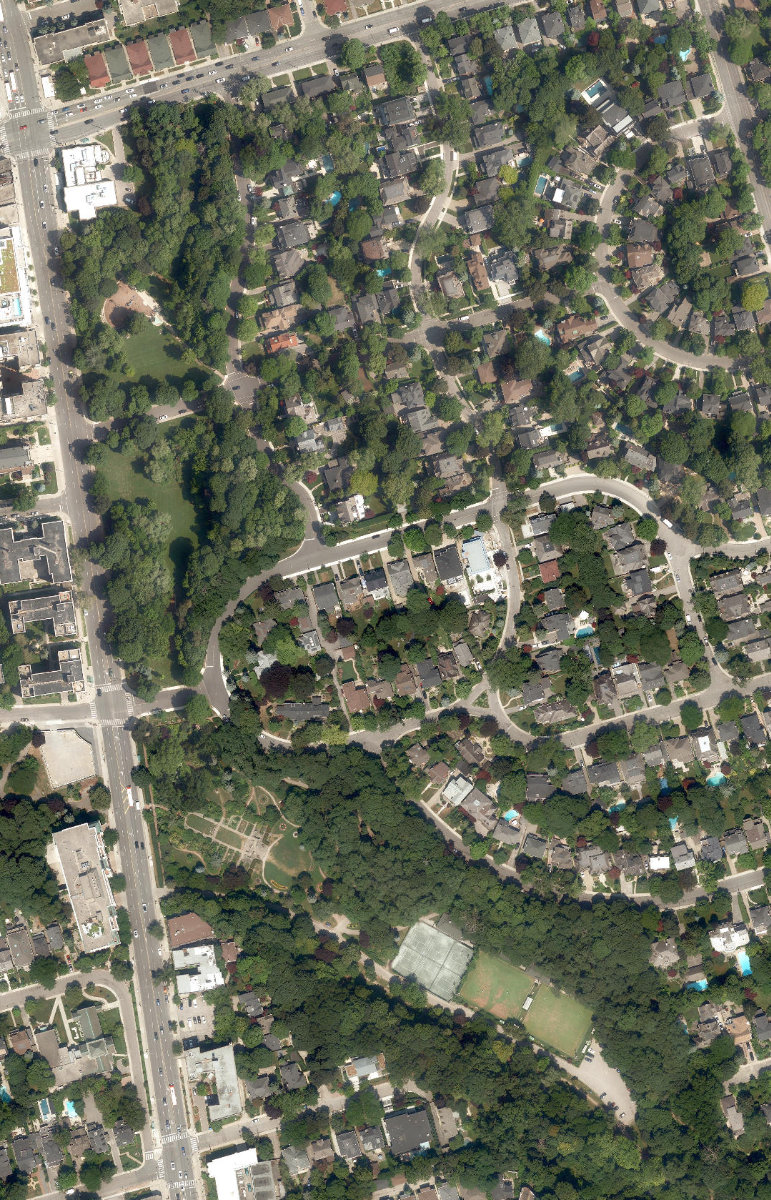
Explain this score
Where did the 41 come from? Each weighted contribution against a neutral 50 baseline. Green = pushed up; red = pulled down.
Sum of contributions = the headline score. A negative bar means that dimension dragged the park below the city-wide neutral baseline.
Why this park works
Lawrence Park Ravine works because its connectivity score (80) is one of the city's strongest and its amenity diversity (33) is also top decile (42 transit stops sit within a 400 m walk; 29 intersections fall within 100 m of the edge).
What limits this park
Lawrence Park Ravine is held back by edge activation (0, below-average): the surrounding streets carry too few active uses to spill into the park; border-vacuum risk is also elevated (100).
Most distinctive characteristic
Most distinctive feature: exceptionally high connectivity (80, top decile).
Jacobs reading
Lawrence Park Ravine sits between an urban social park and an ecological retreat: moderately useful for both, exceptionally suited to neither.
Tradeoffs
- The park is enclosed by buildings (85) but the surrounding streets are quiet (edge activation 0): frame without animation.
- High connectivity coexists with high border-vacuum risk (100): much of that connectivity is to highways, rail, or parking lots, not to neighbourhoods.
Performance in context
- A modest overperformer for its ravine / naturalized park typology (+6 vs the median in medium Ravine / Naturalized Park ravine).
Typology classification
Classified as Ravine / Naturalized Park: 99% ravine overlap, 20% canopy. Secondary read: Corridor / Linear Park (shape elongation 2.6× a circle of equal area).
Edge Activation
Within 100 m of the park edge: 17 active uses (retail, transit_stop) and 13 dead/hostile uses (parking_lot, highway, rail). Active edges keep "eyes on the park" through the day; parking lots, blank institutional walls, rail and highway frontages drain street life.
Source: OSM POIs (amenity/shop) + Toronto Building Footprints + land use
Connectivity
Connectivity blends paths, intersections, transit, entrances, and edge density. This park has 19 mapped paths/walkways and 68 sidewalk segments within 50 m; 29 street intersections within 100 m; 42 transit stops within a 400 m walk; 9 estimated access points across ~1,956 m of perimeter. edge density is healthy, no superblock penalty. Source coverage: centreline, pedestrian_network, transit_osm.
Source: Toronto Centreline V2 + Pedestrian Network + OSM transit stops
Amenity Diversity
4 distinct amenity types in the park (fitness, playground, tennis, washroom). Diversity, not raw count, drives the score so a park with many distinct activity types can outrank a larger park that repeats the same use.
Source: Toronto Parks & Recreation Facilities + OSM amenity tags
Natural Comfort
Natural-comfort components for this park: 19.5% estimated tree canopy; 98.8% inside the ravine system; nearest waterbody ~302 m; 21 city-mapped trees inside the polygon (4.5/ha). Reading: ravine-cooled. Source coverage: treed_area, ravine, waterbodies, street_trees. Impervious surface is approximated (Toronto's authoritative layer ships only as a raster GeoTIFF).
Source: Toronto Treed Area + Ravine + Waterbodies + Street Tree Inventory
Enclosure / Eyes on Park
173 buildings within 25 m of the park edge (45 mid-rise, 127 low-rise, 1 tower); avg edge height 9.0 m (~3 floors); 8.8 buildings per 100 m of 1,956 m perimeter (strong frontage density); edges are at a Jacobs-scale walkable mid-rise (3 to 7 floors); 1 tower ≥ 40 m within 25 m of the edge. "Eyes on the park" come strongest from the 45 mid-rise edge buildings.
Source: Toronto 3D Massing (building footprints + heights)
Border Vacuum Risk
Border-vacuum factors within 50 m of the park: Yonge Street, parking_lot, Yonge Street, Yonge Street, rail, rail, Yonge Street, Yonge Street, parking_lot. Jacobs warned that highways, rail, parking lots and blank institutional edges act as "vacuums" that suppress foot traffic and isolate the park from its neighbourhood.
Source: Toronto Street Centreline (highways) + rail layer + OSM landuse + building footprints
Equity Context
Equity Context requires inputs not yet loaded for this park (Toronto Neighbourhood Profiles). Score is held at a neutral 50 with low confidence. Read with caution.
Source: Toronto Neighbourhood Profiles
Amenities (4 types · 4 records)
- fitness
- playground
- tennis
- washroom
Nearby active-edge features (58)
- parking lot0 m
- parking lot9 m
- rail11 m
- rail11 m
- highway: Yonge Street13 m
- highway: Yonge Street13 m
- highway: Yonge Street13 m
- transit stop: Chatsworth Drive23 m
- transit stop: East side stop Yonge Street26 m
- retail: Munk Hearing Centre30 m
- retail: Food Plus Market30 m
- highway: Yonge Street36 m
- highway: Yonge Street37 m
- transit stop: East side stop Yonge Street42 m
- transit stop: Yonge St at St Edmund's Dr44 m
- transit stop: Lawrence Station51 m
- retail53 m
- transit stop: Lawrence Station58 m
- highway: Yonge Street58 m
- transit stop: Yonge St at Lawrence Ave W59 m
- transit stop: West side stop Yonge Street60 m
- transit stop: Lawrence Station64 m
- highway: Yonge Street66 m
- transit stop: Lawrence Station69 m
- transit stop: Lawrence Station70 m
- transit stop: Yonge St at Lawrence Ave E72 m
- highway: Yonge Street76 m
- retail: Dollarama89 m
- retail: Loblaws CityMarket94 m
- parking lot96 m
- highway: Yonge Street100 m
- cafe: Tim Hortons101 m
- restaurant: Freshii103 m
- retail: Zoom Optical106 m
- parking lot110 m
- retail: Buzzed Buds110 m
- retail: Parkers Cleaners112 m
- retail: Dollarama124 m
- transit stop: Lorindale Avenue130 m
- highway: Yonge Street132 m
- transit stop: Glengrove Avenue137 m
- highway: Yonge Street138 m
- highway: Yonge Street140 m
- transit stop: Lorindale Avenue141 m
- retail: Sheridan Nurseries150 m
- transit stop: Glengrove Avenue151 m
- transit stop: Weybourne Crescent151 m
- highway: Yonge Street152 m
- transit stop: Lawrence156 m
- transit stop: Lawrence160 m
- retail: The Sign of the Skier174 m
- retail: Naz Beauty & Skincare180 m
- retail: Fari Hard Custom Tailoring181 m
- transit stop: Glengowan Road182 m
- retail183 m
- parking lot183 m
- transit stop: Cardinal Place185 m
- transit stop: Glengowan Road192 m
Park profile
Five-axis radar across the structural dimensions.
Citywide percentile ranks
Across all Toronto parks in the dataset.
- Overall vitality80th
- Edge activation32th
- Connectivity99th
- Amenity diversity96th
- Natural comfort82th
- Enclosure91th
Most similar parks
Closest in metric space across the five structural dimensions.
- Oriole Park - TorontoNeighbourhood Park42
- Monarch ParkNeighbourhood Park45
- David A. Balfour ParkRavine / Naturalized Park39
- Riverdale Park WestRavine / Naturalized Park46
- Woburn Park - North YorkCorridor / Linear Park45
Most opposite parks
Furthest in metric space. Useful for recognising what kind of park this isn’t.
- Rouge ParkRavine / Naturalized Park18
- Trca Lands ( 58)Waterfront Park18
- Rouge ParkRavine / Naturalized Park21
- Queen'S Quay Traffic IslandWaterfront Park49
- Toronto Islands - Muggs Island ParkRavine / Naturalized Park25
Visitor signals
Public attention measured by Google Places aggregates. This proxies attention, not occupancy. Aggregate-only: no usernames, no review text, no extra photos beyond the cached hero.
p27 citywide · p37 within Ravine / Naturalized Park
Source: Google Places API · match high (0.95 composite confidence) · last refreshed 5/9/2026. Privacy contract. Measures public attention, not occupancy.
Human activity signals: not available
No activity signals have landed for this park yet. The model has scored its physical form but it can’t yet say how often it’s programmed, photographed, or walked through. See /data-ethics for what we will and will not collect.
Does this score feel accurate?
Your read of Lawrence Park Ravinematters. We’re testing whether the model lines up with how people actually use the park. Submissions are stored locally; no account needed.
Tell us how this park feels
We measure structure (canopy, edges, connectivity). You measure feeling. Both matter, and disagreement is itself useful civic data.
What would improve this park?
Generated from the weakest measured dimensions: a starting point, not a prescription.
- Activate the edges: encourage cafés, retail or community uses on the streets that face the park; replace blank or parking-lot edges where possible.
- Diversify what people can do in the park (playground, washroom, water, shade, performance, sport, garden): even small additions raise this score.
- Mitigate border vacuums (highways, rail, parking) with active programming on the still-permeable edges and treat the hostile edge as a design challenge.
Data sources
- City of Toronto Open Data: Parks (Green Space)Polygon boundaries, official names, types.
- Parks & Recreation FacilitiesInventory of in-park amenities (washrooms, fields, rinks…).
- Toronto Pedestrian NetworkSidewalk segments around and through parks; estimated park entrances.
- Toronto Centreline V2Street segments + intersection nodes near park edges; trails and walkways.
- Toronto 3D MassingBuilding footprints + heights for edge-building counts, frontage density, and tower-in-the-park risk.
- Toronto Treed AreaTree canopy share inside park polygons via stratified-grid sampling.
- Toronto Waterbodies & RiversWater surface inside parks + nearest-water distance for cooling.
- Ravine & Natural Feature ProtectionRavine overlap as a cooling / natural-comfort signal.
- Toronto Street Tree InventoryTree count + density inside park polygons.
- Neighbourhood Profiles(Pending) Equity context proxy.
- OpenStreetMap (Overpass API)Cafés, restaurants, retail, transit stops, parking, highways, rail.