Skymark Park
Other, one of the city's strongest overall (score 53, rank ~98th percentile). Strongest: edge activation; weakest: enclosure.
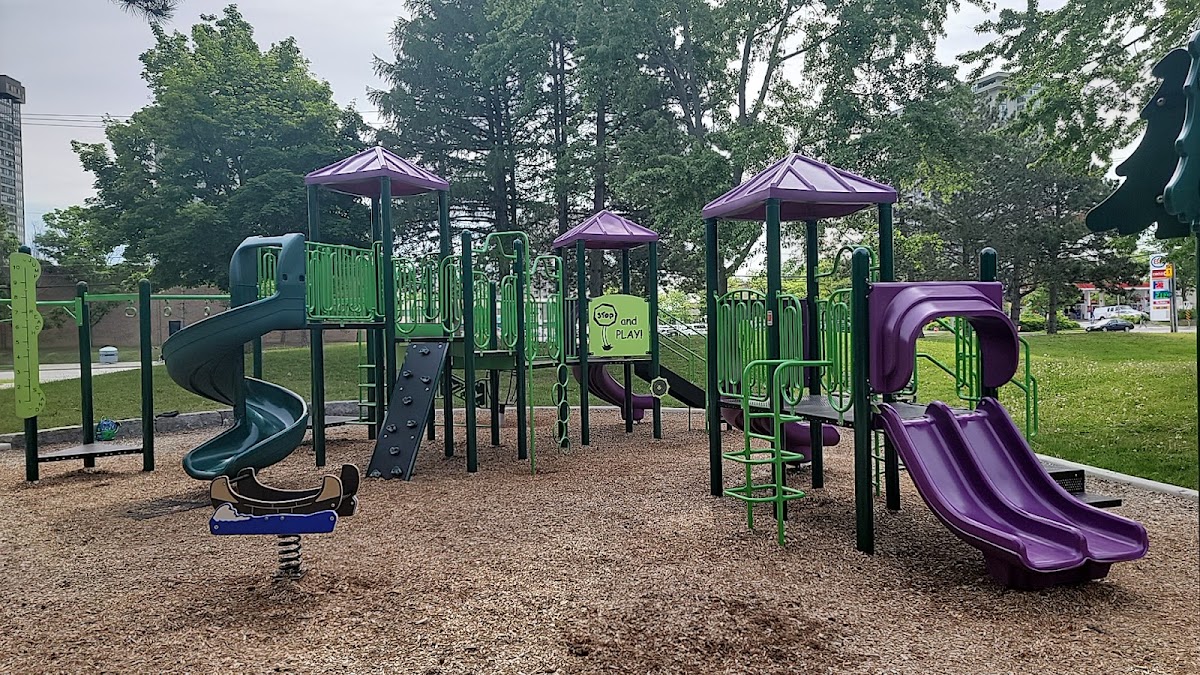
Photo by Mariela Bedoya via Google Places · cached 5/9/2026
Skymark Park scores 52.7 / 100. Strongest dimensions: connectivity and enclosure / eyes on park. Weakest: amenity diversity (11.9). Border-vacuum risk is low. This score is a transparent reading of Jane Jacobs-style vitality factors, not a definitive judgment.
Area · 3.26 ha
Weighted across six dimensions · confidence 72%
Scores are not bell-curved. Percentiles and expected scores provide context without changing the underlying model.
Loading map…
The parks map is loading.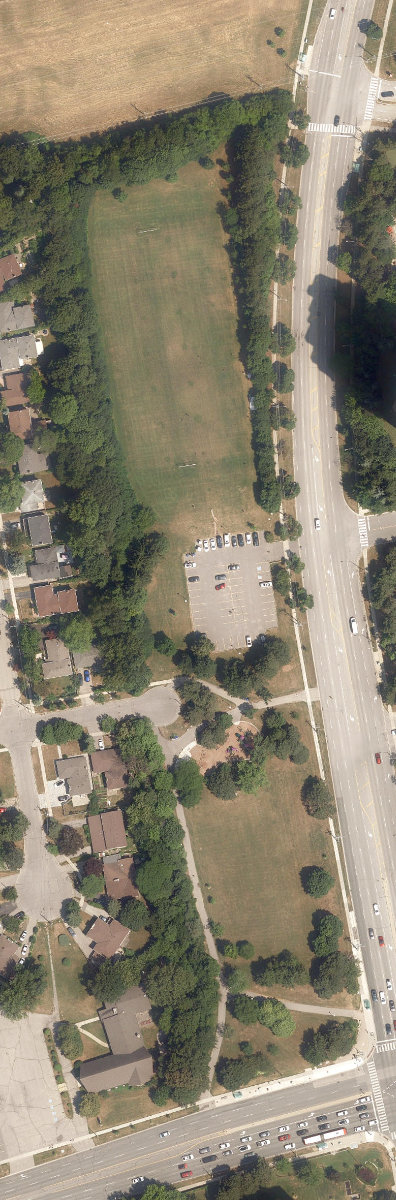
Explain this score
Where did the 53 come from? Each weighted contribution against a neutral 50 baseline. Green = pushed up; red = pulled down.
Sum of contributions = the headline score. A negative bar means that dimension dragged the park below the city-wide neutral baseline.
Why this park works
Skymark Park works because its edge activation score (51) is one of the city's strongest and its connectivity (70) is also top decile (its perimeter is lined with active uses).
What limits this park
Skymark Park doesn't have a clear weakness. Every measured dimension is at or above the middle of the pack.
Most distinctive characteristic
Most distinctive feature: exceptionally high edge activation (51, top decile).
Jacobs reading
Skymark Park sits between an urban social park and an ecological retreat: moderately useful for both, exceptionally suited to neither.
Performance in context
- This park is a strong overperformer for its cohort: raw 53 versus an expected 28 for similar parks (medium Other) (gap +25).
Typology classification
Classified as Other: does not meet any specific typology threshold (3.3 ha, 1 amenity types, frontage 4.3/100m)
Edge Activation
Within 100 m of the park edge: 18 active uses (retail, cafe, transit_stop) and 3 dead/hostile uses (parking_lot). Active edges keep "eyes on the park" through the day; parking lots, blank institutional walls, rail and highway frontages drain street life.
Source: OSM POIs (amenity/shop) + Toronto Building Footprints + land use
Connectivity
Connectivity blends paths, intersections, transit, entrances, and edge density. This park has 7 mapped paths/walkways and 27 sidewalk segments within 50 m; 10 street intersections within 100 m; 33 transit stops within a 400 m walk; 5 estimated access points across ~1,040 m of perimeter. moderate edge density, small superblock penalty applied. Source coverage: centreline, pedestrian_network, transit_osm.
Source: Toronto Centreline V2 + Pedestrian Network + OSM transit stops
Amenity Diversity
1 distinct amenity types in the park (playground). Diversity, not raw count, drives the score so a park with many distinct activity types can outrank a larger park that repeats the same use.
Source: Toronto Parks & Recreation Facilities + OSM amenity tags
Natural Comfort
Natural-comfort components for this park: 17.4% estimated tree canopy; nearest waterbody ~768 m; 17 city-mapped trees inside the polygon (5.2/ha). Reading: exposed. Source coverage: treed_area, waterbodies, street_trees. Impervious surface is approximated (Toronto's authoritative layer ships only as a raster GeoTIFF).
Source: Toronto Treed Area + Ravine + Waterbodies + Street Tree Inventory
Enclosure / Eyes on Park
45 buildings within 25 m of the park edge (0 mid-rise, 43 low-rise, 2 tower); avg edge height 8.4 m (~3 floors); 4.3 buildings per 100 m of 1,040 m perimeter (strong frontage density); edges are low-rise (mostly 2 to 3 floors); 2 towers ≥ 40 m within 25 m of the edge. "Eyes on the park" come strongest from the 0 mid-rise edge buildings.
Source: Toronto 3D Massing (building footprints + heights)
Border Vacuum Risk
Border-vacuum factors within 50 m of the park: Skymark Park. Jacobs warned that highways, rail, parking lots and blank institutional edges act as "vacuums" that suppress foot traffic and isolate the park from its neighbourhood.
Source: Toronto Street Centreline (highways) + rail layer + OSM landuse + building footprints
Equity Context
Equity Context requires inputs not yet loaded for this park (Toronto Neighbourhood Profiles). Score is held at a neutral 50 with low confidence. Read with caution.
Source: Toronto Neighbourhood Profiles
Amenities (1 types · 1 records)
- playground
Nearby active-edge features (47)
- parking lot: Skymark Park0 m
- transit stop: Don Mills Road at Finch Avenue East4 m
- transit stop: Don Mills Road at Finch Avenue East4 m
- transit stop: Finch Avenue at Don Mills Road West Side5 m
- transit stop: Don Mills Road / Premier Davis Boulevard13 m
- transit stop: Don Mills Road / Premier Davis Boulevard18 m
- transit stop: Don Mills Road at Skymark Drive30 m
- transit stop: Don Mills Road at Premier Davis Boulevard33 m
- transit stop: Don Mills Road at Premier Davis Boulevard34 m
- transit stop: Finch Avenue at Don Mills Road35 m
- transit stop: Don Mills Road at Skymark Drive36 m
- cafe: Tim Hortons42 m
- retail: Circle K47 m
- parking lot57 m
- transit stop: Don Mills Road at Finch Avenue East63 m
- retail: Mr. Lube64 m
- transit stop: Don Mills Road at Finch Avenue East65 m
- parking lot72 m
- transit stop: Finch Avenue at Don Mills Road75 m
- retail: No Frills77 m
- transit stop: Finch Avenue at Don Mills Road East Side85 m
- parking lot100 m
- retail: One's Better Living114 m
- restaurant: KFC116 m
- restaurant: Deer Garden Signatures122 m
- parking lot123 m
- transit stop: Don Mills Road at Bedle Avenue124 m
- parking lot124 m
- restaurant: Mizuki Sushi130 m
- restaurant: Subway136 m
- transit stop: Don Mills Road at Bedle Avenue136 m
- parking lot138 m
- parking lot141 m
- parking lot143 m
- retail: Convenience Flowers146 m
- restaurant: Vietnamese Delight150 m
- restaurant: Tasty BBQ Seafood Restaurant161 m
- transit stop: Brahms Avenue161 m
- transit stop: Linus Road163 m
- retail: Skymark Cleaners170 m
- restaurant: Grass Mountain Villa Seafood175 m
- retail: Hair Focus181 m
- parking lot182 m
- transit stop: Don Mills Road at Bedle Avenue183 m
- retail: Freedom Mobile185 m
- parking lot189 m
- parking lot192 m
Park profile
Five-axis radar across the structural dimensions.
Citywide percentile ranks
Across all Toronto parks in the dataset.
- Overall vitality98th
- Edge activation96th
- Connectivity91th
- Amenity diversity71th
- Natural comfort71th
- Enclosure45th
Most similar parks
Closest in metric space across the five structural dimensions.
- PAM McCONNELL AQUATIC CENTRE - Building GroundsCivic Square52
- Valleyfield ParkWaterfront Park56
- Edwards GardensRavine / Naturalized Park51
- City Wide Open SpaceCorridor / Linear Park52
- Mike Bela ParkNeighbourhood Park50
Most opposite parks
Furthest in metric space. Useful for recognising what kind of park this isn’t.
- Toronto Islands - Muggs Island ParkRavine / Naturalized Park25
- Trca Lands ( 26)Ravine / Naturalized Park27
- Rouge ParkRavine / Naturalized Park18
- Rouge ParkRavine / Naturalized Park21
- Rouge ParkRavine / Naturalized Park26
Visitor signals
Public attention measured by Google Places aggregates. This proxies attention, not occupancy. Aggregate-only: no usernames, no review text, no extra photos beyond the cached hero.
p21 citywide
Source: Google Places API · match unverified (0.00 composite confidence) · last refreshed 5/9/2026. Privacy contract. Measures public attention, not occupancy.
Human activity signals: not available
No activity signals have landed for this park yet. The model has scored its physical form but it can’t yet say how often it’s programmed, photographed, or walked through. See /data-ethics for what we will and will not collect.
Does this score feel accurate?
Your read of Skymark Parkmatters. We’re testing whether the model lines up with how people actually use the park. Submissions are stored locally; no account needed.
Tell us how this park feels
We measure structure (canopy, edges, connectivity). You measure feeling. Both matter, and disagreement is itself useful civic data.
What would improve this park?
Generated from the weakest measured dimensions: a starting point, not a prescription.
- Diversify what people can do in the park (playground, washroom, water, shade, performance, sport, garden): even small additions raise this score.
Data sources
- City of Toronto Open Data: Parks (Green Space)Polygon boundaries, official names, types.
- Parks & Recreation FacilitiesInventory of in-park amenities (washrooms, fields, rinks…).
- Toronto Pedestrian NetworkSidewalk segments around and through parks; estimated park entrances.
- Toronto Centreline V2Street segments + intersection nodes near park edges; trails and walkways.
- Toronto 3D MassingBuilding footprints + heights for edge-building counts, frontage density, and tower-in-the-park risk.
- Toronto Treed AreaTree canopy share inside park polygons via stratified-grid sampling.
- Toronto Waterbodies & RiversWater surface inside parks + nearest-water distance for cooling.
- Ravine & Natural Feature ProtectionRavine overlap as a cooling / natural-comfort signal.
- Toronto Street Tree InventoryTree count + density inside park polygons.
- Neighbourhood Profiles(Pending) Equity context proxy.
- OpenStreetMap (Overpass API)Cafés, restaurants, retail, transit stops, parking, highways, rail.